HVAC Job Costing: How to Track Every Dollar and Maximize Profit Per Job
March 17, 2026 - 28 min read

March 17, 2026 - 28 min read

Table of Contents
| TL;DR: HVAC job costing is the process of tracking every dollar spent on each job, labor at the true burdened rate, materials, overhead, and travel time. Most contractors discover their actual costs are 10–20% higher than estimated. This guide covers the four cost components, the formulas you need, real-world examples by job type, and how FieldCamp automates the entire process so you know your true profit on every single job. |
Here is something most HVAC contractors will not admit: they do not actually know what their jobs cost.
They know what they charge. They know what they pay techs. They have a rough idea of what parts cost. But when you ask them the true, fully loaded cost of that AC repair they ran last Tuesday: labor, materials, drive time, overhead, the whole picture, most of them guess.
And that gap between what you think a job costs and what it actually costs? That is exactly where your profit disappears.
This is what job costing solves. Not pricing (that is what you charge the customer). Job costing is about tracking every dollar you spend on each job, so you know with certainty which jobs make you money, which ones break even, and which ones quietly drain your business.
If you have ever finished a busy month, looked at your bank account, and wondered where all the money went, you have a job costing problem. If your pricing side needs attention first, our detailed HVAC pricing guide is a good place to start. Otherwise, let us fix the costing.
KEY HIGHLIGHTS
HVAC Job Costing: What You’ll Learn
Job costing is the process of tracking all costs associated with a specific job — not your business as a whole, but each individual service call, installation, or maintenance visit.
Think of it this way:
Most HVAC contractors set their prices once, maybe adjust them yearly, and assume they are making money as long as invoices go out. But pricing without costing is like driving without a dashboard. You might be going 80 miles an hour. You might also be running on fumes.
The “profitable on paper, broke in reality” problem hits HVAC businesses hard because the industry has so many hidden costs. Travel time that nobody tracks.
Warranty callbacks that eat into last month’s margins. Overhead that gets ignored because it does not show up on a job ticket. These things add up, and without job-level cost tracking, you will never see them.
Contractors who implement job costing typically discover their actual costs are 10–20% higher than they estimated. That difference is the gap between a thriving business and one that is constantly chasing cash flow.
Every HVAC job you run, whether it is a 30-minute thermostat swap or a full system installation, has four cost buckets. Miss any one of them, and your job cost numbers will be wrong.
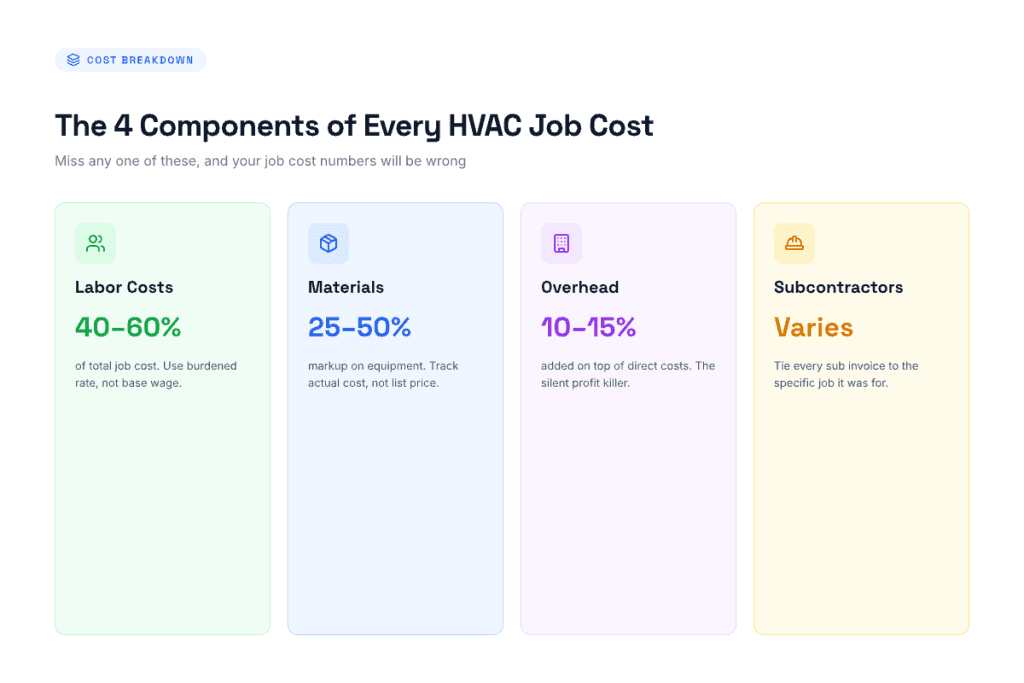
Labor is usually the single biggest line item, eating up 40–60% of total job cost for most HVAC companies.
But here is where contractors get it wrong: they calculate labor cost as “what I pay the tech per hour.” That is your wage rate, not your labor cost. Your true labor cost, called the “burdened” or “loaded” rate, includes everything that comes with employing that person:
Example: If you pay a tech $30/hour, your actual burdened labor cost might look like this:
| Cost Element | Amount |
| Base wage | $30.00 |
| Payroll taxes (8%) | $2.40 |
| Workers comp (10%) | $3.00 |
| Benefits (health insurance, PTO) | $5.50 |
| Tools/uniforms | $0.60 |
| Burdened rate | $41.50/hour |
That is a 38% difference between what you think labor costs and what it actually costs. Multiply that across every tech, every job, every week — the math gets ugly fast.
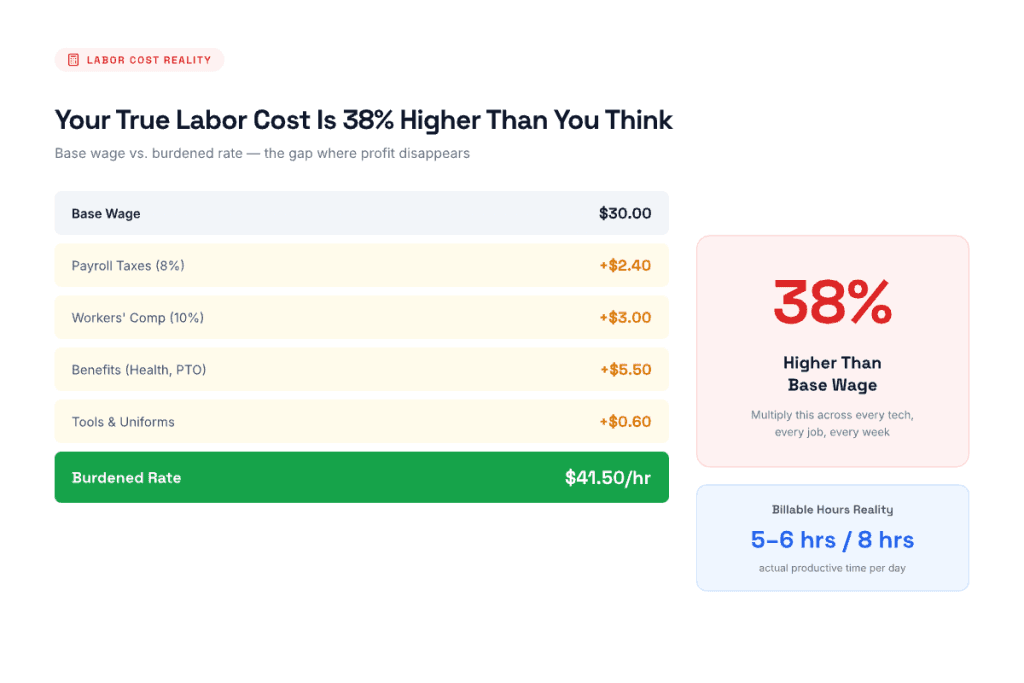
Then there is the billable vs. non-billable hours problem. Your techs are on the clock for 8 hours, but how many of those hours are spent doing billable work on a customer’s system? Between morning meetings, drive time, parts runs, paperwork, and callbacks, most HVAC techs are only productively billable for 5–6 hours per day. That means your effective labor cost per billable hour is even higher than the burdened rate.
And do not forget travel time. Every minute a tech spends driving between jobs is labor cost with zero revenue attached. If your average drive time is 30 minutes per job and you run 5 jobs a day, that is 2.5 hours of paid time producing nothing. Route optimization can cut this down significantly, but you have to track it first before you can improve it.
Materials are the second major cost bucket, and they are deceptively tricky to track accurately.
The obvious costs are easy: the compressor you installed, the filter you replaced, the refrigerant you charged. But accurate material costing means tracking:
Material markup is a separate topic from job costing, but knowing your true material costs is what makes accurate markup possible. Most HVAC contractors mark up equipment 25–50% and smaller parts 100% or more. If you do not know what you actually paid for parts, your markup percentages are fiction.
Effective inventory management ties material usage to specific jobs automatically, so you are not guessing at the end of the month which parts went where.
Overhead is the silent profit killer. It includes every cost that keeps your business running but cannot be tied directly to a single job:
Many contractors ignore overhead in their job costing because it is hard to allocate. But ignoring it creates a dangerous illusion: jobs look profitable when they are not, because overhead is eating the margin you thought you had.
The standard formula for overhead allocation is:
Overhead Cost Per Hour = Total Monthly Overhead ÷ Total Monthly Billable Hours
For example, if your monthly overhead is $18,000 and your team logs 900 billable hours per month, your overhead cost per hour is $20. That means every hour a tech works on a job, you need to add $20 to the job cost just to cover the lights being on.
As a rule of thumb, most HVAC companies should add 10–15% on top of direct costs to cover overhead allocation. If your overhead is higher than that relative to your revenue, it is a sign you need to either grow revenue or cut fixed costs.
Not every HVAC job is handled entirely by your crew. When you bring in subcontractors — electricians for panel upgrades, duct fabricators, crane operators for rooftop units — those costs belong to the job.
Subcontractor costs are straightforward to track (you get an invoice), but they are easy to miss in job costing if your system does not have a place for them. Make sure every subcontractor invoice gets tied to the specific job it was for, not dumped into a general “subcontractor” expense category.
Formulas are only useful if you can actually plug in real numbers and get an answer that helps you make decisions. Here are the ones that matter for HVAC contractors, with real-world examples.
Total Job Cost = Labor + Materials + Overhead Allocation + Subcontractors
Example — Residential AC repair:
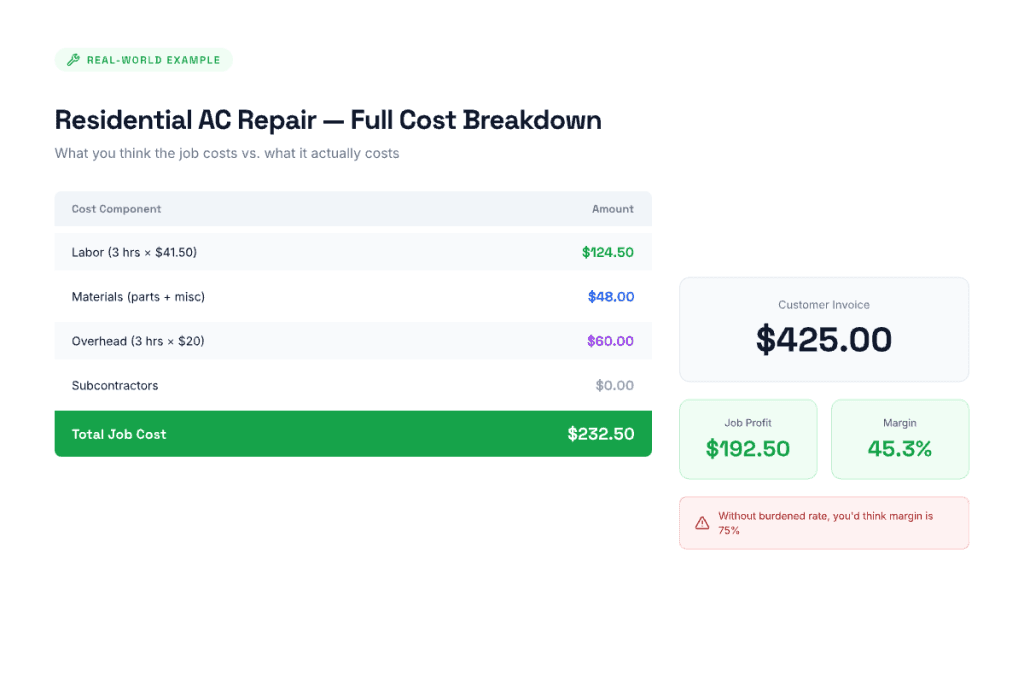
If you charged the customer $425 for this repair, your job profit is $192.50 — a 45% margin. That is healthy. But if you only counted labor at the $30 base rate ($90) and the main part ($18), you would think the job cost $108, and your margin was 75%. That kind of error, repeated across hundreds of jobs, is how businesses go broke while looking busy.
Cost Per Billable Hour = Burdened Labor Rate + Overhead Per Hour
Using our earlier numbers: $41.50 + $20.00 = $61.50 per billable hour
This is the number that tells you the absolute minimum you need to generate per hour to break even. Anything below this, and you are losing money — even if the customer pays and the tech did great work.
Job Profit = Revenue − Total Job Cost
Profit Margin = (Job Profit ÷ Revenue) × 100
Example:
Break-Even Rate = (Annual Overhead + Annual Labor Costs) ÷ Annual Billable Hours
This tells you the hourly rate you must charge — at minimum — to cover all your costs before any profit.
Example:
If your average billing rate is $125/hour, you are making $24/hour in profit per billable hour. If it is $95/hour, you are losing money on every job — even though checks are coming in.
For a healthy HVAC business:
If your margins consistently come in below these benchmarks, job costing will show you exactly where the money is going. Without it, you are just guessing.
Let us walk through three real-world HVAC scenarios with full cost breakdowns. These use realistic 2026 numbers, though your actual costs will vary by market, region, and business size.
Scenario: Customer’s 4-ton AC unit has a failed compressor. The system is 6 years old. Tech diagnoses, gets approval, and replaces the compressor the same day.
| Cost Component | Detail | Amount |
| Labor | Diagnosis: 0.5 hr + Repair: 3.5 hr = 4 hr × $41.50 | $166.00 |
| Travel | Round trip: 0.75 hr × $41.50 | $31.13 |
| Materials | Compressor: $485, refrigerant (5 lbs): $75, misc parts: $35 | $595.00 |
| Overhead | 4.75 total hours × $20/hr | $95.00 |
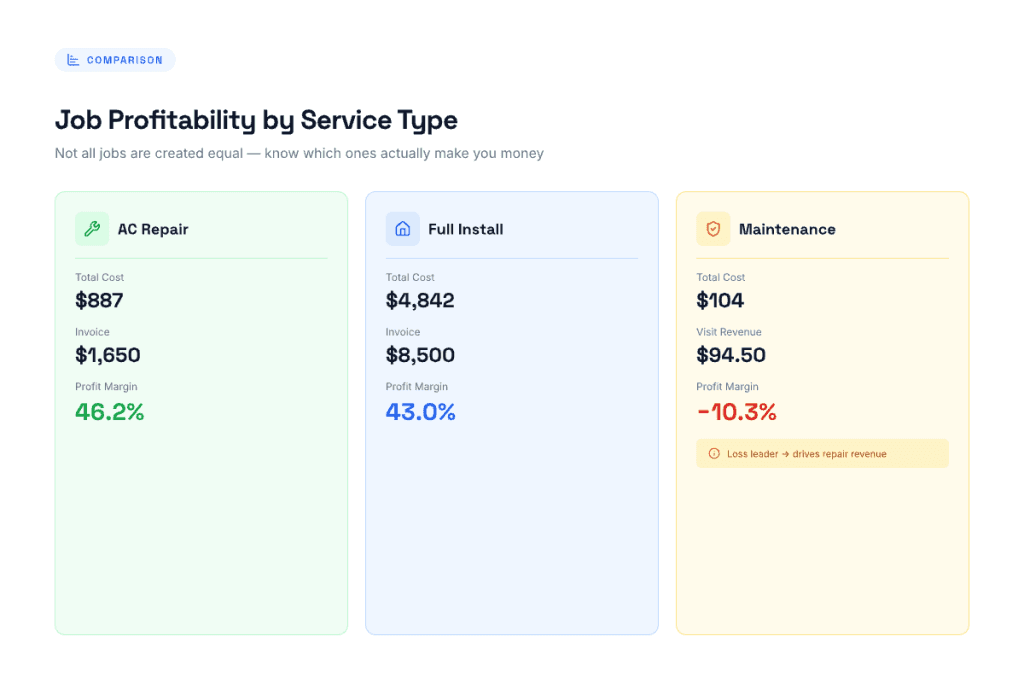
| Total Job Cost | $887.13 | |
| Customer Invoice | $1,650.00 | |
| Job Profit | $762.87 | |
| Profit Margin | 46.2% |
This is a solid job. But what if the tech had to make a second trip because the compressor from the supply house was the wrong model? Add another 2 hours of labor ($83), another trip ($31.13), and overhead ($40).
Suddenly, your job cost is $1,041, and your margin drops to 36.9%. That is why tracking actuals, not estimates- matters.
Scenario: Residential new construction, 3-ton split system install. Two-tech crew, full-day job.
| Cost Component | Detail | Amount |
| Labor | 2 techs × 8 hours × $41.50 | $664.00 |
| Travel | Round trip: 1 hr × $41.50 × 2 techs | $83.00 |
| Materials — Equipment | Condenser + air handler | $3,200.00 |
| Materials — Supplies | Line set, disconnect, pad, thermostat, misc | $385.00 |
| Overhead | 18 total labor hours × $20/hr | $360.00 |
| Permit fees | $150.00 | |
| Total Job Cost | $4,842.00 | |
| Customer Invoice | $8,500.00 | |
| Job Profit | $3,658.00 | |
| Profit Margin | 43.0% |
Installations typically carry higher dollar profit but similar or slightly lower margins compared to repairs. The key variable is labor efficiency; a two-day install instead of one day would add another $664 in labor and $360 in overhead, dropping the margin to 33.9%. Proper job scheduling and preparation prevent these overruns.
Scenario: Semi-annual maintenance visit on a residential system. Part of a maintenance plan contract.
| Cost Component | Detail | Amount |
| Labor | 1 tech × 1 hour × $41.50 | $41.50 |
| Travel | Round trip: 0.5 hr × $41.50 | $20.75 |
| Materials | Filter, cleaning supplies | $12.00 |
| Overhead | 1.5 total hours × $20/hr | $30.00 |
| Total Job Cost | $104.25 | |
| Visit Revenue (annual contract $189 ÷ 2 visits) | $94.50 | |
| Job Profit | −$9.75 | |
| Profit Margin | −10.3% |
Wait, a loss? Yes. Many maintenance visits are break-even or slightly negative when you track the actual costs. But here is why contractors still run them: maintenance contracts generate repair and replacement leads. That compressor replacement job from the first example? It probably came from a maintenance visit where the tech spotted the failing compressor.
Job costing helps you understand this dynamic. You are not losing money on maintenance — you are investing in a customer relationship pipeline. But you need to know the numbers so you can price your contracts correctly and make sure the repair and replacement revenue more than makes up for the maintenance cost.
This is where tracking HVAC job profitability across the full customer lifecycle becomes essential, not just per visit.
After working with thousands of HVAC contractors, these are the job costing mistakes we see over and over.
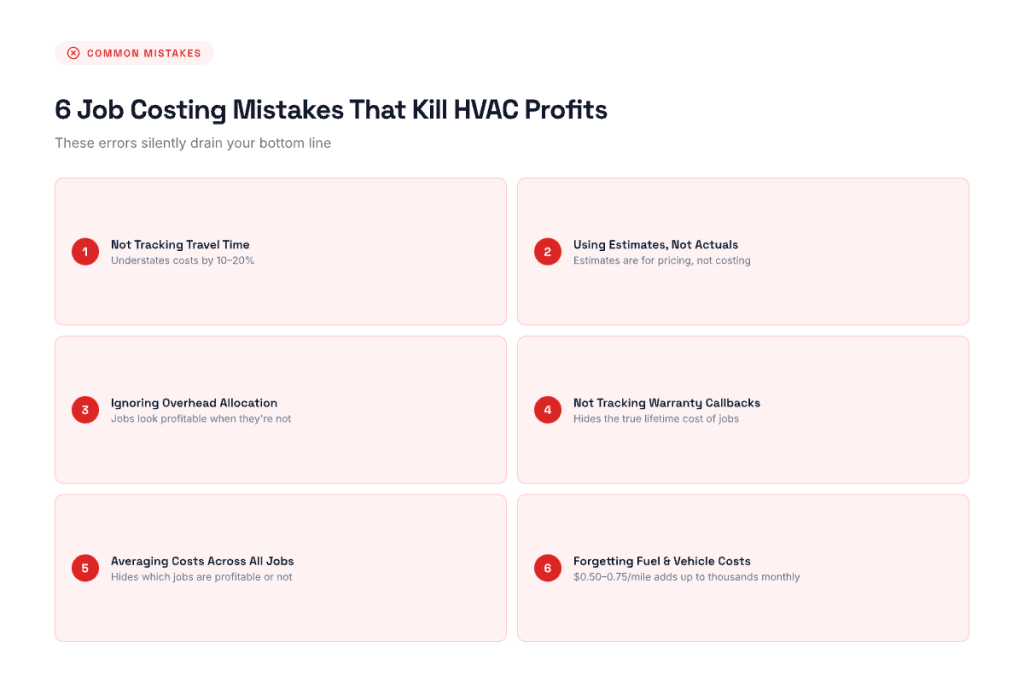
Every minute a tech spends in the van is a minute you are paying for with zero revenue coming in. If you do not track travel time as a labor cost on each job, you are understating your true costs by 10–20%.
The fix: log drive time on every job ticket. Better yet, use GPS-based tracking that captures it automatically. When you see the real travel numbers, you will be motivated to optimize routes and schedule geographically clustered jobs, which is where route optimization pays for itself many times over.
Your flat-rate price book says a capacitor replacement takes 45 minutes. Your tech took 90 minutes because the unit was on the roof, the access panel was rusted shut, and the wiring was non-standard. If you log 45 minutes in your costing, you are lying to yourself.
Always track actual time spent and actual materials used. Estimates are for pricing. Actuals are for costing. Mixing them up defeats the entire purpose.
“The job made money” is a dangerous statement when you have not allocated overhead. A job that brings in $400 on $200 of direct costs (labor + materials) looks like a $200 profit. But when you add the $80 in overhead for those 4 hours consumed, plus the $15 in vehicle cost for the trip, plus the dispatcher time to schedule it, your actual profit is closer to $105. Still profitable — but 47% less than you thought.
When a tech goes back to fix something under warranty, that return visit has a cost: labor, fuel, time, and overhead. But most contractors do not charge it to the original job. They either absorb it as general overhead or do not track it at all.
Best practice: tie warranty callback costs to the original job. This shows you the true lifetime cost of that job and helps you identify patterns, maybe certain equipment brands have higher callback rates, or certain types of installations need better quality control.
Some contractors track total monthly costs and total monthly revenue, then assume every job has the same margin. This is the worst form of job costing because it hides the most important information: which specific job types, technicians, or customers are profitable and which are not.
A residential AC repair might have a 45% margin, while a commercial chiller repair has a 15% margin. If you average them, you think everything is running at 30% and make no changes. Per-job costing reveals the truth and lets you make smarter decisions about what work to pursue, how to price it, and where to improve.
Your trucks cost money every mile they roll. Between fuel, insurance, maintenance, depreciation, and financing, most HVAC service vehicles cost $0.50–0.75 per mile to operate. On a job with a 25-mile round trip, that is $12.50–18.75 in vehicle cost that needs to be part of the job cost. It is not huge on any single job, but across hundreds of jobs per month, it adds up to thousands.
There are three ways to approach HVAC job costing, ranging from simple and manual to automated and real-time. The right choice depends on your business size, volume, and how serious you are about knowing your numbers.
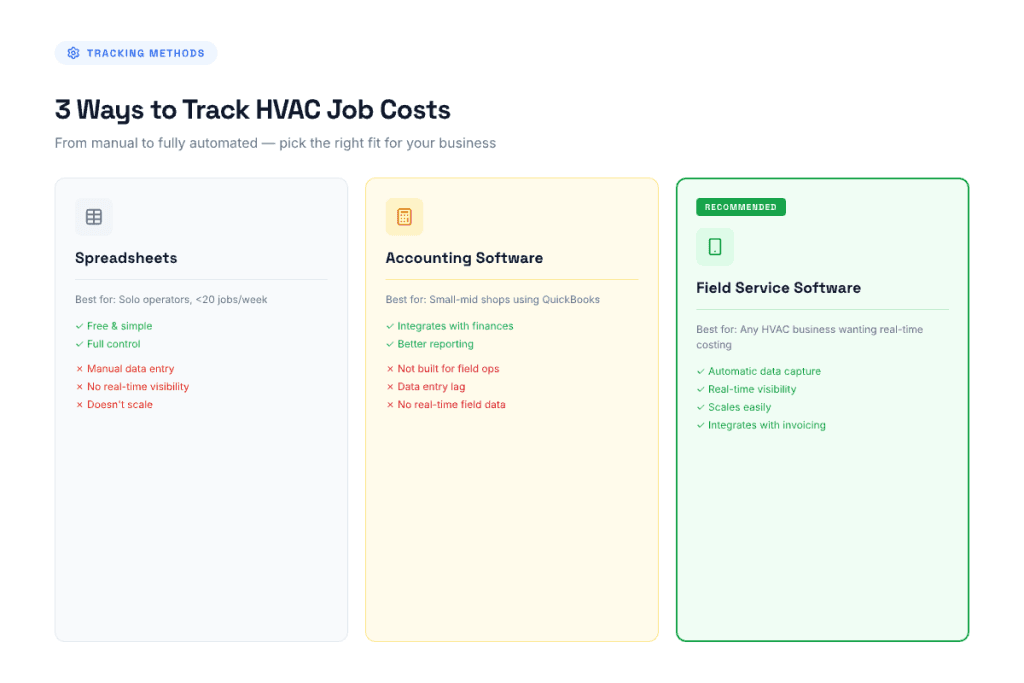
Best for: solo operators or very small shops running fewer than 20 jobs per week.
A basic job costing spreadsheet tracks job number, customer name, date, tech assigned, hours worked (including travel), burdened labor cost, materials used and cost, overhead allocation, total job cost, invoice amount, and profit margin.
You can build this in Excel or Google Sheets with basic formulas. The math is not hard. The hard part is discipline; someone has to enter every job’s data consistently and accurately. The moment you skip a week or estimate instead of entering actuals, the spreadsheet becomes useless.
Pros: free, simple, full control over the format. Cons: manual data entry is tedious, easy to fall behind, no real-time visibility, and it does not scale beyond a few techs.
Best for: small to mid-size shops that already use QuickBooks and want better visibility.
QuickBooks and similar accounting platforms have job costing features that let you assign income and expenses to specific jobs or projects. You can track materials, labor, and overhead by job, and run profitability reports.
The limitation is that accounting software works with financial data, not field data. Your techs are not entering their hours into QuickBooks from the job site. Someone in the office is entering data after the fact, which means delays and potential errors. And it does not capture operational data like travel time, route efficiency, or real-time job progress.
Pros: integrates with your existing financial workflow, better reporting than spreadsheets. Cons: not built for field operations, data entry lag, and no real-time field data.
Best for: any HVAC business that wants accurate, real-time job costing without manual data entry.
Field service management platforms like FieldCamp combine job management, scheduling, dispatching, and costing into a single system. Because techs are already using the app to receive jobs, clock in/out, and log work, the cost data flows in automatically.
This is the only method where job costing happens in real time; you can see the cost of a job building as the tech works, not days or weeks later when someone gets around to entering numbers.
Pros: automatic data capture, real-time visibility, integrates with invoicing, and scales easily. Cons: monthly software cost (though this typically pays for itself many times over in improved margins).
Manual job costing works in theory. In practice, most contractors start with good intentions and stop within a month because the data entry is too tedious. The only sustainable approach is automation — letting your software capture cost data as a byproduct of normal operations.
Here is how FieldCamp handles each piece of the job costing puzzle.
When your techs clock in and out of jobs through the FieldCamp mobile app, their actual hours are recorded automatically. No timesheets to fill out, no end-of-day guessing. The system captures start time, end time, break time, and travel time for every job. You get accurate labor costs without asking your techs to do anything extra.
Every part and material used on a job gets logged and tied to that specific job record. Your techs can scan barcodes or select from your parts catalog right on their phone. This feeds into both your inventory management (so you know what needs reordering) and your job cost tracking (so you know exactly what each job consumed).
Set your overhead rate once, and FieldCamp applies it automatically to every job based on hours logged. Your job profitability reports show true profit margins, not the inflated numbers you get when overhead is ignored.
Travel time is a cost. AI-powered route optimization minimizes drive time between jobs, which directly reduces your labor cost per job. Less windshield time means more wrench time, and more wrench time means better margins.
When a job is complete, FieldCamp generates the invoice from the same system that tracked the costs. Revenue automatically matches to cost data, so your profit calculations are always based on actual numbers, not a disconnected spreadsheet where the revenue column might not match what was actually billed.
Smart dispatch and scheduling do not just assign the closest tech. It considers skill level, job complexity, travel time, and workload balance. Sending the right tech to the right job the first time reduces callbacks, overtime, and wasted hours, all of which directly impact job costs.
The workflow builder automates repetitive processes like parts ordering, follow-up scheduling, and job status updates. Every manual process you eliminate is overhead you reduce, which improves your cost per job across the board.
The bottom line: FieldCamp turns job costing from a chore into a byproduct. Your team does their normal work, and the cost data builds itself. No spreadsheets, no guessing.
Once you have job costing data flowing, these are the key performance indicators that tell you how your business is really doing.

Track this by job type (repair, install, maintenance) and by individual job. Look for trends: are margins improving, declining, or holding steady? A declining trend means your costs are rising faster than your prices; it’s time to adjust.
Benchmark: 40–50% gross margin on repairs, 35–45% on installations, break-even to slight loss on maintenance visits (offset by upsell revenue).
This measures productivity. If Tech A generates $1,200 per day and Tech B generates $800, the job costing data will tell you why: is Tech B running fewer jobs, taking longer on each job, or working on lower-value jobs?
You can explore more about HVAC technician productivity benchmarks in our salary and efficiency guide.
What does it cost you to get a customer call (marketing spend divided by number of leads), and what does the average job generate? If you spend $85 to get a lead and the average job produces $180 in profit, your return on marketing is solid. If the average job only produces $50 in profit, you are spending more to acquire the work than the work is worth.
Every callback is a job with costs and no revenue. If your first-time fix rate is 85%, that means 15 out of every 100 jobs require a return visit, 15 trips with full labor and travel costs, and zero additional revenue. Getting this number from 85% to 95% can improve your overall margins more than almost any other single change.
The right HVAC apps and tools help techs access manuals, wiring diagrams, and equipment history on-site, which directly improves first-time fix rates.
Total billable hours divided by total paid hours. This tells you how efficiently you are converting paid time into revenue-generating time. Industry average is around 60–70%. Best-in-class HVAC companies hit 75–80%.
If your ratio is below 60%, you have too much non-billable time, drive time, admin, waiting for parts, or underutilization. Job costing data pinpoints exactly where the time is going.
Most HVAC contractors who implement job costing have the same reaction: “I had no idea that job type was losing me money.” Or: “I thought my best tech was my most profitable, turns out it was my second tech.”
The numbers do not lie. But you have to track them to see the truth.
Whether you start with a spreadsheet or go straight to automated software, the important thing is to start. Pick your next 10 jobs and track every cost, labor (burdened rate, not base rate), all materials, travel time, and overhead allocation. Calculate the real profit on each one. Compare it to what you thought you were making.
That gap between assumption and reality is your opportunity. Close it, and you will not just be busy — you will be profitable.
See Exactly What Your HVAC Jobs Cost — In Real Time
FieldCamp captures labor hours, materials, travel time, and overhead automatically as your techs work. No spreadsheets. No end-of-day data entry. Just accurate job profitability reports that show you where your margins are, and where they’re leaking.
Job pricing is what you charge the customer; it is forward-looking and based on estimates, flat rates, or time-and-materials billing. Job costing is what the job actually costs you; it is backward-looking and based on actual labor, materials, overhead, and any other costs incurred. Pricing determines your revenue. Costing determines your profit. You need both, and they should inform each other. If your job costing reveals that a particular service consistently costs more than your pricing assumes, it is time to raise prices for that service. For help setting competitive rates, see our HVAC pricing guide.
Target a gross profit margin of 50–55% and a net profit margin (after all overhead and expenses) of 15–25%. Top-performing HVAC companies consistently hit 20%+ net margins, while the industry average hovers around 10–15%. If your net margin is below 10%, your business is at risk, one bad month, one lawsuit, or one equipment failure could put you underwater. Job costing is the fastest way to identify where your margins are leaking and fix them.
Add up all your monthly overhead costs: rent, insurance, vehicle payments, office staff, software, marketing, everything that is not directly tied to a single job. Divide that total by the number of billable hours your team works in a month. The result is your overhead cost per hour. Then, for any given job, multiply that rate by the number of hours worked on the job. For example, if your monthly overhead is $15,000 and your team works 750 billable hours, your overhead rate is $20/hour. A 3-hour job gets allocated $60 in overhead.
Absolutely. Travel time is one of the highest hidden costs in HVAC service. Your techs are on the clock during drive time, you are paying their wages, burning fuel, and putting miles on the truck. Not tracking it means you are understating your true job costs by 10–20% on average. Log the drive time on every job ticket, or better yet, use a field service platform that captures it automatically via GPS.
At a minimum, review job costing reports monthly. This lets you spot trends in margins, identify underperforming job types, and catch cost overruns before they become habits. Weekly reviews are even better, especially if you are just starting to implement job costing and want to build the habit. The best practice is to have real-time visibility, when you can check a job’s profitability while the tech is still on-site, you can make adjustments before costs get out of control. Reporting tools that update in real time make this practical.
Yes, arguably more than large companies. Small HVAC businesses operate on thinner margins with less room for error. A single underpriced job type or a tech who consistently takes too long can have an outsized impact on a small company’s bottom line. Job costing software reveals these issues quickly so you can address them. And modern platforms like FieldCamp are built to scale, whether you have 2 techs or 50, the data works the same way. Many contractors start with job costing when they realize they are busy but not profitable, and it becomes the foundation for growing their HVAC business sustainably.