
Capacity Planning with AI: Know Your True Operational Limits
You’ve got six technicians, 42 jobs this week, and a gut feeling you’re cutting it close. By Thursday afternoon, three emergency calls come in. You’re scrambling—moving jobs, begging techs to stay late, and telling customers “maybe tomorrow.
Sound familiar? This is what happens when field service teams schedule reactively instead of planning ahead.
Capacity planning in field service is the process of forecasting technician availability against incoming job demand to ensure you can fulfill customer requests without overloading your team. When you add AI to the mix, you’re using historical job data, seasonal patterns, and growth trends to predict future capacity needs weeks or months in advance—not just filling tomorrow’s calendar.
Here’s what that looks like in practice: An HVAC company in March receives an AI warning that May capacity will fall short by 15%. That warning triggers a hiring decision before emergency calls start getting missed, not after customers are already waiting a week for service.
Most field service managers schedule reactively—filling today’s calendar without looking ahead. AI capacity planning flips that model entirely. Instead of discovering you’re short-staffed when it’s already too late, you see the problem coming and act before it costs you revenue or customer trust.
This article explains what capacity planning actually means in field service operations, how AI predicts future capacity needs, and how to use capacity data to make confident hiring decisions instead of guessing.
What Capacity Planning Actually Means in Field Service?
Capacity planning isn’t an abstract business concept. It’s the difference between a dispatcher who sleeps well at night and one who dreads Monday mornings.
At its core, capacity equals technician hours available versus job demand (hours needed). When demand exceeds available hours, jobs get pushed, customers wait, and revenue walks out the door.
Most dispatchers think about capacity only when it’s already too late—Thursday afternoon panic mode, when the schedule is packed and three emergency calls just landed. By then, the options are limited: overtime, missed appointments, or unhappy customers. None of those are good for business.
The real distinction here is between “filling today’s schedule” (reactive) and “planning next month’s capacity” (proactive). Reactive scheduling asks: “Who can take this job today?” Proactive capacity planning asks: “Will we have enough technicians to handle May’s demand?”
That shift in thinking changes everything about how you operate. If you want to understand how this fits into broader operational improvements, our guide on field service optimization covers the full picture.
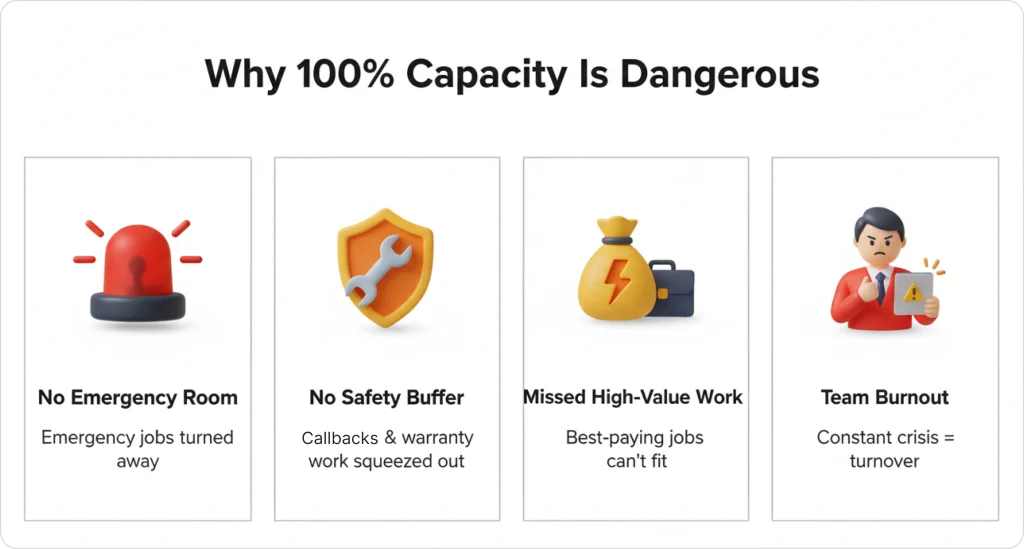
Why Running at 100% Capacity Is Actually Dangerous?
When your schedule looks “full,” you might think that’s a good thing. It’s not. Here’s why running at maximum capacity creates problems:
- No room for emergency calls. High-value same-day jobs that generate premium revenue get turned away.
- No buffer for callbacks or warranty work. These protect your reputation but require schedule flexibility.
- No space to accept unexpected high-value jobs. The best-paying work often appears without warning.
- Dispatcher burnout from constant firefighting. When every day is a crisis, good people leave.
Difference True Capacity vs. Calendar Capacity
Consider an HVAC company with 4 technicians, each working 8-hour shifts. That looks like 32 total hours per day on paper.
But actual assignable capacity after travel, breaks, and buffer time? Roughly 20 hours per day.
If the average job takes 2 hours, true daily capacity equals 10 jobs—not 16.
Understanding this gap between “calendar hours” and “assignable hours” is the foundation of effective capacity planning. Most field service teams overestimate what they can actually accomplish, which leads to rushed work, late arrivals, and frustrated customers.
How AI Predicts Future Capacity Needs?
AI capacity forecasting analyzes patterns too complex for manual tracking. While a dispatcher might remember that “summers are busy,” AI quantifies exactly how busy—and projects specific shortfalls weeks before they happen.
What AI Analyzes?
AI examines historical job data to understand your operation’s rhythm: job volume patterns, seasonal spikes, and growth trends. For example, if AC repair jobs increase 60% every July compared to April, AI factors into May hiring recommendations. The system projects weeks in advance, giving you time to hire and onboard before demand hits.
This is fundamentally different from traditional dispatching approaches. To understand the technical foundations behind this forecasting, our guide on types of machine learning models in AI dispatching explains how these systems learn from your data.
The Early Warning System
AI flags warnings when projected demand exceeds available capacity. These aren’t vague alerts—they’re specific and actionable:
- “Projected 8-job shortfall in 6 weeks”
- “May capacity utilization will exceed 90%”
- “Current growth rate will require +2 technicians by June 1”
The value here is lead time. Eighteen days of warning gives you enough time to post a job listing, interview candidates, hire someone qualified, and get them trained before the crunch hits. Without that lead time, you’re reacting to problems instead of preventing them.
Example: Plumbing Company Forecast
A plumbing company in March sees steady 25 jobs per week. The AI detects a historical pattern: May averages 38 jobs per week due to spring maintenance surge.
Current capacity: 30 jobs per week maximum.
AI flags in March: “Projected 8-job shortfall in 6 weeks—consider hiring or limiting new bookings.”
This warning arrives while there’s still time to act. Without it, the dispatcher discovers the problem in May when customers are already waiting 5+ days for service.
Based on FieldCamp’s analysis of 50,000+ scheduled jobs across 2024, AI capacity forecasting predicts seasonal capacity curves with 92% accuracy.
The Capacity Formula: Calculating True Available Capacity
Before AI can forecast capacity, you need to understand how capacity is actually calculated. The formula is straightforward, but most field service teams get it wrong because they don’t account for the realities of a typical workday.
The Formula
Technician hours – travel time – breaks – buffer = assignable capacity
An “8-hour shift” doesn’t mean “8 hours of jobs.” Here’s what actually happens during a typical day:
| Time Component | Hours |
| Total shift | 8.0 |
| Travel between jobs | -1.5 |
| Lunch break | -1.0 |
| Buffer for delays | -0.5 |
| Assignable capacity | 5.0 |
That’s a 37.5% reduction from what the calendar shows. If you’re scheduling based on 8 hours instead of 5, you’re setting your team up to fail before the day even starts.
Scaling to Team Level
For a team of 5 technicians with 5 assignable hours each, daily capacity is 25 hours. If the average job takes 2.5 hours, the team can complete 10 jobs maximum—not the 16 that calendar hours suggest.
This is why most field service teams overestimate capacity by 30–40%. They schedule based on what the calendar shows instead of what’s actually achievable.
AI dispatching systems apply this formula automatically, factoring in each technician’s actual travel patterns, break schedules, and historical buffer needs. For a deeper dive into how these systems manage constraints, see our guide on how AI dispatcher algorithms work.
The 80% Rule—Why AI Flags Warnings Before You Hit 100%
The 80% capacity rule means AI systems flag capacity warnings when technician utilization reaches 80%—not 100%—because the final 20% is needed for emergencies, callbacks, and schedule flexibility.
In practice, a team running at sustained high utilization is already at risk of missed appointments and dispatcher burnout, even though the calendar looks “full but manageable.”
Why 100% Is a Problem
The final 20% of your capacity serves critical functions:
- Emergency response: High-value same-day calls that generate premium revenue
- Callbacks: Warranty work and follow-up visits that protect your reputation
- Schedule flexibility: Buffer for jobs that run long or traffic delays
- High-value work: Space to accept profitable jobs that appear unexpectedly
When you’re booked solid, you can’t say yes to any of these. That costs you money and damages customer relationships.
What Happens When You Ignore the 80% Rule
Example: Electrical Company at 88% Capacity
An electrical company runs at 88% capacity for 4 weeks straight. The calendar looks busy but manageable.
Week 5: Two emergency calls arrive plus one callback. Three jobs can’t be scheduled same-day.
Result:
- Lost revenue: $1,200
- Angry customers: 2 negative reviews
- Dispatcher stays late 3 nights to reschedule
This scenario plays out constantly in field service operations. The schedule looked fine until it wasn’t. Understanding your field service metrics helps you spot these patterns before they become problems.
Stop Guessing Your Capacity Limits
FieldCamp’s AI monitors utilization in real-time and flags warnings at 80%—before customers experience delays.
Seasonal Capacity Curves: Planning for Predictable Surges
Every service industry has seasonal patterns. HVAC peaks in summer and winter. Plumbing surges in spring. Lawn care explodes from April through September. These patterns are predictable, which means they’re manageable—if you plan for them.
AI learns these curves from historical data and projects hiring windows months in advance.
How AI Handles Seasonal Demand?
AI doesn’t just notice that “summer is busy.” It quantifies the exact increase and projects specific capacity gaps:

- Pattern detection: “July job volume is 189% of April volume”
- Capacity projection: “Current team can handle 30 jobs/week; July demand = 52 jobs/week”
- Hiring timeline: “Recommend hiring 2 technicians by May 15 to allow onboarding before peak”
This level of specificity transforms vague seasonal awareness into actionable hiring plans.
HVAC Company Capacity Curve Example
For an HVAC company, January averages 18 jobs/week with 2 technicians. July surges to 52 jobs/week, requiring 5 technicians. AI warns in March: “Projected July shortfall = 22 jobs/week. Recommend hiring 2 techs by May 15.”
That March warning gives the owner three months to hire and train—time that disappears if you wait until June to realize you’re overwhelmed.
Reactive vs. Proactive Hiring
Reactive hiring starts in May when you’re already overwhelmed. You post listings while missing customer calls, hire quickly without proper vetting, train poorly because everyone’s too busy, and the new tech isn’t productive until mid-July—halfway through peak season.
Proactive hiring starts in April. You interview calmly during slower weeks, train thoroughly, and have a productive team member ready by June 1.
FieldCamp customers using AI capacity forecasting reduce seasonal hiring delays by an average of 3.5 weeks. That’s nearly a month of additional productive capacity during your busiest season.
For context on how this approach differs from traditional methods, see our guide on AI dispatching evolution: from paper to automation.
The Hiring Trigger Matrix: When to Add Headcount?
AI removes hiring guesswork by providing specific, data-backed thresholds. Hire too early and you’re paying for capacity you don’t need. Too late and you’re losing customers. The key is knowing which signals matter.
Hiring Trigger Thresholds
| Indicator | Threshold | Action |
| Avg capacity utilization | Sustained above 85% | Start recruiting |
| Unassigned jobs in queue | 15+ jobs waiting 3+ days | Hire within 30 days |
| Overtime hours | 10+ hours/week team-wide | Immediate hire needed |
| Customer wait time | 5+ days average | Capacity crisis—hire now |
Why Data-Backed Triggers Matter?
A single busy week doesn’t mean you need another technician. Sustained utilization above threshold does.
Hiring triggers based on sustained capacity trends—not one-off busy weeks—prevent both premature hiring and crisis hiring. The distinction matters because one costs you money unnecessarily while the other costs you customers.
The Cost of Getting Timing Wrong
Hiring too late:
- Missed appointments during the gap
- Overtime costs while short-staffed
- Customer churn from long wait times
- Reputation damage from negative reviews
- New hire trained during chaos, learns bad habits

Hiring too early:
- Payroll costs before revenue justifies them
- Underutilized technician affects morale
- Cash flow pressure during slower periods
FieldCamp data shows companies that hire based on AI capacity triggers vs. gut feeling reduce new-hire ramp time by 40% because they onboard before the crisis hits. When you hire during a calm period, you have time to train properly. When you hire during a crisis, the new tech is thrown into the deep end.
For more on building effective teams, FieldCamp’s team management features help you track capacity and performance across your workforce.
Multi-Week Capacity Forecasting: Looking Beyond Today
AI capacity planning forecasts availability 4–8 weeks ahead, not just today. This distinction matters because it transforms capacity warnings from reactive alerts into proactive planning tools.
How Multi-Week Forecasting Works?

AI doesn’t just schedule today—it forecasts weeks ahead using multiple data sources:
- Historical patterns: Same-period job volume from previous years
- Current growth trends: Month-over-month increases in demand
- Seasonal data: Known spikes for your industry and region
- Booking velocity: How quickly new jobs are being added
Week-by-Week Forecast Example (Plumbing Company)
| Week | Projected Utilization | Status |
| Week 1 (current) | 82% | ✅ Comfortable |
| Week 2 | 79% | ✅ Comfortable |
| Week 3 | 84% | ⚠️ Approaching threshold |
| Week 4 | 91% | ⚠️ Warning |
| Week 5 | 96% | 🚨 Critical |
AI recommendation in Week 1: “Projected capacity shortfall in 4 weeks. Recommend hiring or limiting new bookings starting Week 3.”
Why 18 Days Matters?
Based on FieldCamp’s analysis of 50,000+ scheduled jobs across 2024, multi-week forecasting prevents 92% of capacity-related missed appointments by flagging bottlenecks an average of 18 days in advance.
Eighteen days is enough time to post a job listing, interview candidates, hire someone qualified, complete basic onboarding, and have the new technician productive before the crunch hits.
Without that lead time, you’re reacting to problems instead of preventing them—and customers pay the price.
For visibility into how your team performs against forecasts, FieldCamp’s field service reporting software provides the data you need to validate and improve your capacity planning.
Forecast Capacity Weeks Ahead
See projected bottlenecks before they happen. FieldCamp’s AI gives you 4-8 weeks of visibility to plan hires, not scramble.
Capacity vs. Utilization: Why 100% Is Actually Bad?
These two terms sound similar but mean different things—and confusing them leads to operational problems that show up in customer complaints and technician burnout.
Capacity = total hours available
Utilization = percentage of capacity currently assigned

The 100% Utilization Trap
When utilization hits 100%, your schedule looks perfect on paper. Every technician is fully booked. No gaps. Maximum efficiency, right?
Wrong. It’s not efficient—it’s fragile.
100% utilization means:
- Zero flexibility for emergencies
- No room for jobs that run long
- No space for high-value work that appears unexpectedly
- Every delay cascades through the entire schedule
One traffic jam or one job that runs 30 minutes over creates problems for every appointment that follows.
Optimal Utilization: 75–80%
The sweet spot for sustained operations is 75–80% utilization. This leaves enough buffer for real-world variability while keeping technicians productive.
Company A: 98% Utilization
- Every tech fully booked
- Emergency call comes in at 2 PM
- No one available
- Customer goes to competitor
- Lost revenue: $850
Company B: 78% Utilization
- Slight buffer in schedule
- Emergency call comes in at 2 PM
- Tech 3 has 90-minute gap
- Customer serviced same-day
- Captured revenue: $850
Industry benchmark data from Field Service News (2023) shows field service businesses maintaining 75–80% utilization report 22% higher profit margins than those running above 90%, due to better emergency response and premium job capture.
“Keeping techs busy” isn’t the same as “running a profitable operation.” The most profitable teams leave room to say yes to high-value opportunities.
Understanding how AI matches jobs to available capacity is key here. Our guide on how AI matches jobs to technicians explains the optimization logic that makes this work.
Real Scenario Walkthrough: Capacity Planning in Action
Let’s walk through a complete scenario from AI warning to resolution, showing how capacity planning works in practice when you have real decisions to make.
Scenario: Metro Plumbing Co. in March
Current State:
- 4 technicians
- Averaging 28 jobs/week
- 76% capacity utilization
- Operations running smoothly
AI Warning (March 15): “Projected May capacity: 42 jobs/week demand vs. 30 jobs/week capacity. Shortfall: 12 jobs/week (40% over capacity).”
Decision Options
The owner has four choices, each with trade-offs:
Option 1: Hire 2 technicians by May 1
- Cost: $8K/month in additional payroll
- Benefit: Solves problem completely
- Risk: If demand projection is wrong, overstaffed
Option 2: Limit new bookings in May
- Cost: $0 direct cost, but ~$18K in lost revenue
- Benefit: Protects service quality for existing customers
- Risk: Competitors capture the customers you turn away
Option 3: Expand capacity with Saturday shifts
- Cost: ~$2K in overtime
- Benefit: Partial solution, no permanent commitment
- Risk: Technician burnout, only adds ~20% capacity
Option 4: Do nothing
- Cost: 48 unassigned jobs over the month
- Benefit: None
- Risk: Customer churn, reputation damage, dispatcher burnout
What Metro Plumbing Chose?
After reviewing the options, the owner decided on a hybrid approach:
- Hired 1 technician (started April 10)
- Added Saturday shifts for May only
Outcome:
- Handled 38 of 42 projected jobs (90% fulfillment)
- Avoided full hiring cost of 2 technicians
- Maintained service quality for existing customers
- New technician proved valuable, kept on staff
The AI forecast gave Metro Plumbing 6 weeks of lead time. Without it, they would have discovered the problem in May when customers were already waiting a week for service.
FieldCamp customers using capacity forecasting capture an average of $12,400 more revenue per quarter by avoiding capacity-related booking limits.
For more field service management approaches, our guide on field service management strategies covers planning frameworks that complement capacity forecasting.
How FieldCamp Handles Capacity Planning?
Continuous capacity monitoring tracks utilization in real-time, not just at week’s end. As jobs are booked or completed, projections update automatically. When utilization crosses 80%, the system flags the risk before customers experience delays.
Key Capabilities
- 80% threshold warnings: Flags when projected demand exceeds safe capacity limits
- 4–8 week forecasting: Projects capacity needs using historical patterns + seasonal trends + growth rate
- Hiring trigger alerts: Specific thresholds like sustained utilization above 85% plus 15 unassigned jobs
- Daily scheduling integration: Won’t overbook technicians beyond safe limits
FieldCamp’s AI dispatch scheduling connects capacity awareness directly to job assignment, so the system respects your true capacity limits in every scheduling decision.
What Makes This Different?
Most scheduling tools only show “who’s available today.” FieldCamp shows “who’ll be available in 6 weeks.”
This distinction matters because:
- Capacity warnings are proactive, not reactive
- You see the problem before customers do
- Hiring triggers are data-backed, not gut-based
- Seasonal patterns are quantified, not guessed
Real Results
- FieldCamp customers reduce seasonal hiring delays by 3.5 weeks on average, allowing new techs to ramp before peak demand hits
- Operations managers report 60% less time spent on “firefighting” schedule conflicts after implementing AI capacity planning
- The system learns from your operation’s specific patterns—your job types, your service area, your seasonal curves—and gets more accurate over time
For setup guidance, the FieldCamp documentation on arrival windows with provider-based capacity explains how automatic capacity calculations work.
See Your Team’s True Capacity
Stop overcommitting. FieldCamp calculates real assignable hours and prevents overbooking automatically.
Capacity planning with AI moves field service operations out of constant firefighting and into control. By understanding true assignable capacity, respecting the 80% utilization rule, and forecasting weeks ahead, teams can make hiring and scheduling decisions before pressure builds.
When emergency calls hit on Thursday afternoon, you’re not guessing—you already know your options. And once capacity is clear, AI ensures work is distributed fairly so top technicians don’t burn out while newer ones ramp up. Tools like FieldCamp connect forecasting, scheduling, and routing into one system, helping teams grow revenue without sacrificing service quality.
Frequently Asked Questions
What’s the difference between scheduling and capacity planning?
Scheduling assigns jobs to technicians for today or this week. Capacity planning forecasts whether you’ll have enough technicians to handle demand 4–8 weeks from now.
Think of it this way: scheduling is tactical (filling the calendar), while capacity planning is strategic (ensuring you have the right team size before bottlenecks happen). You need both, but capacity planning prevents the scheduling nightmares that happen when you’re perpetually short-staffed.
How far ahead should I forecast capacity?
Most field service businesses benefit from 4–8 week capacity forecasts. Seasonal industries like HVAC or lawn care should extend to 12–16 weeks to account for predictable demand surges. FieldCamp’s AI automatically adjusts forecast windows based on your industry patterns.
What if my capacity forecast shows I’m short, but I can’t hire right now?
You have three practical options: limit new bookings temporarily to protect service quality for existing customers, add overtime or weekend shifts to expand capacity short-term, or adjust your service area to reduce travel time and increase assignable hours. FieldCamp’s AI can model each scenario’s impact before you commit.
Does AI capacity planning work for small teams (2–3 techs)?
Yes—and small teams actually benefit more because losing one tech to illness or vacation creates immediate capacity crises. AI helps small operators see these risks early and plan coverage (temp hires, schedule adjustments) before customers are affected.
How does FieldCamp calculate “assignable capacity”?
FieldCamp uses the formula: Total shift hours – average travel time – scheduled breaks – buffer time = assignable capacity. The system learns your team’s actual travel patterns and adjusts calculations automatically, so forecasts stay accurate as your service area or job mix changes.
For more details on scheduling configuration, the FieldCamp documentation on calendar views and dispatching walks through the scheduling interface.
