Technician Workload Management: How AI Stops You From Burning Out Your Best People
April 9, 2026 - 18 min read

April 9, 2026 - 18 min read

Table of Contents
Your best technician just gave two weeks’ notice. Again.
And you know exactly why. They’ve been carrying the team for months while watching others coast with half the workload. They never complained until they found a job somewhere else.
This story plays out in field service companies every single day. The people who leave aren’t the ones coasting. They’re your best performers who finally got tired of being punished for being reliable.
This guide covers everything: the three types of imbalance that cause burnout, why job count alone is a terrible measure of fairness, how AI dispatching mathematically enforces fair distribution, and how to configure it for your business.
What you’ll learn:
Manual dispatching creates predictable patterns of unfairness that destroy team morale over time. Dispatchers aren’t trying to overwork anyone. But when you’re making scheduling decisions under pressure, certain habits form — and those habits systematically burn out your best people.
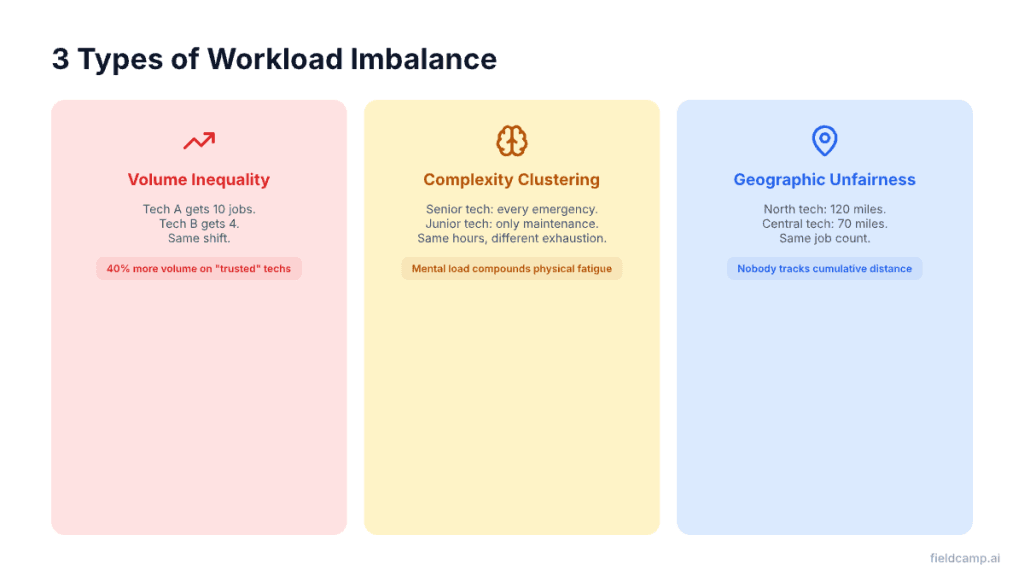
Three types of imbalance drive the problem.
The simplest form: one technician gets significantly more jobs than another on the same shift. Tech A has 10 stops. Tech B has 4.
Dispatchers under pressure default to their most reliable technicians. When a job absolutely needs to get done right, they send the person they trust most. It’s not favoritism — it’s practical decision-making in the moment.
The problem is that a “trusted” technician becomes the default for every difficult situation. Every tight deadline. Every demanding customer. Over weeks and months, this compounds.
Your reliable technician handles 40% more volume than their peers, not because they’re being rewarded, but because they’re being punished for being good at their job.
All the difficult jobs funnel to senior technicians while junior techs only handle routine work.
Picture an HVAC company during summer peak season. The senior technician gets every “No Cool” emergency, complex diagnostics, frustrated customers, and high-pressure situations. Meanwhile, the junior technician handles maintenance calls, straightforward checklists, predictable timelines, and lower stakes.
Both work 8-hour shifts. One finishes exhausted and frustrated. The other finishes early with energy to spare. Complexity clustering accelerates burnout faster than volume alone because mental exhaustion compounds physical fatigue.
The technician covering the north zone drives 40% more miles than the one covering central, because nobody tracks cumulative distance across a full day.
When dispatchers assign jobs one at a time, they optimize for the immediate decision: “Who’s closest right now?” That makes sense in the moment. But nobody accounts for cumulative impact.
By the end of the day, one technician has driven 120 miles while another has driven 70, despite handling the same number of jobs.
Geographic unfairness compounds with fuel costs, vehicle wear, and simple fatigue.
This is one of the key tensions covered in zone-based dispatching; geography and fairness have to be balanced deliberately, not left to default routing logic.
For more on why manual dispatching fails at these calculations, see AI dispatching vs. traditional dispatch software.
“Give everyone 6 jobs” sounds fair. It’s not. A tech with 5 complex installs (8 hours total) is more overloaded than a tech with 7 routine inspections (4 hours total). Job count treats a 15-minute filter swap the same as a 4-hour furnace replacement.
Four dimensions actually determine workload:
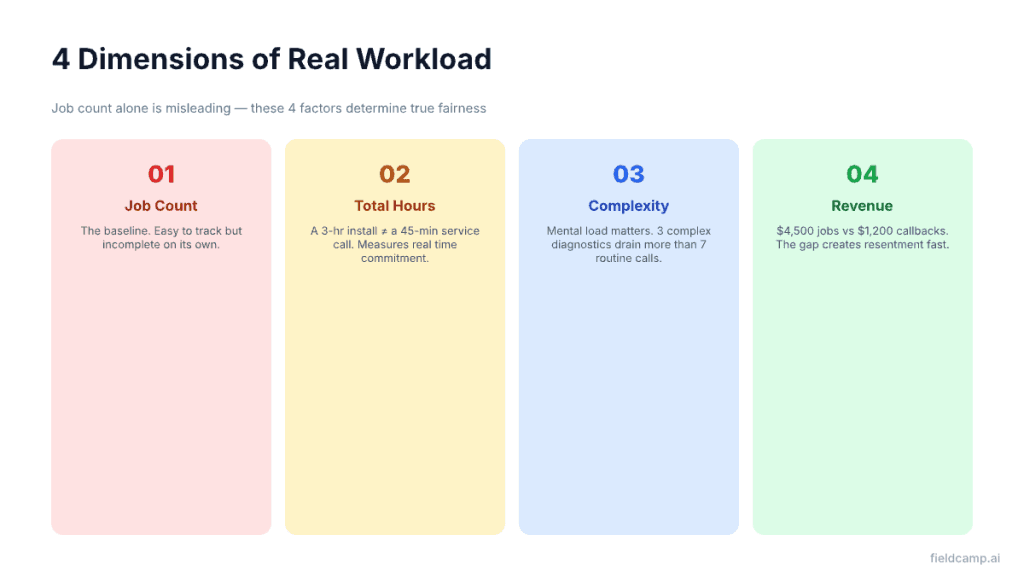
Job count the baseline. Easy to track, but incomplete. Two techs with 6 jobs each might have wildly different workloads depending on what those jobs involve.
Total scheduled hours is the real measure. A 3-hour install counts differently than a 45-minute service call. Measuring total hours per tech reveals actual time commitment, not just the number of stops.
Complexity weighting, mental load matters. A complex commercial diagnostic requires more concentration and energy than a routine maintenance visit. Three complex installs carry more load than seven routine calls, even if the hours are similar.
Revenue distribution, fairness perception. If one tech consistently handles $4,500 jobs while another gets $1,200 callbacks, the gap creates resentment — even if total hours are similar. Distributing high-value work across the team improves morale and develops skills.
Understanding all four dimensions is the foundation of how AI matches jobs to technicians in a system that’s actually fair. Field service reporting software makes revenue distribution visible across your team so you can spot and correct these gaps before they become morale issues.
Every technician starts their morning the same way. They open their mobile app and see their schedule: 10 stops, back-to-back, tight time windows, complex jobs. Then they talk to their colleague. Four stops. Easy maintenance calls. Done by 3 PM.
This comparison happens every single day. Mobile apps make job counts immediately visible to the entire team. Within two or three weeks of visible imbalance, three things happen:
Perception of favoritism develops fast. Technicians start concluding — whether accurate or not — that the dispatcher plays favorites. These perceptions erode trust in every dispatch decision, even the fair ones.
The “Always Available” penalty kicks in. The technician who never complains, always answers their phone, and consistently finishes jobs on time gets punished with the heaviest workload. This creates a perverse incentive: the best way to reduce your workload is to become less reliable. The technicians who figure this out protect themselves. The ones who don’t burn out.
Trust in scheduling collapses. Once trust is gone, every scheduling decision becomes suspect. “Why did I get this emergency? Because I’m closest, or because I’m the dumping ground?” To understand how AI evaluates fairness across multiple variables simultaneously, see how AI dispatching algorithms work.
The skill trap forms silently and only becomes visible when someone quits.
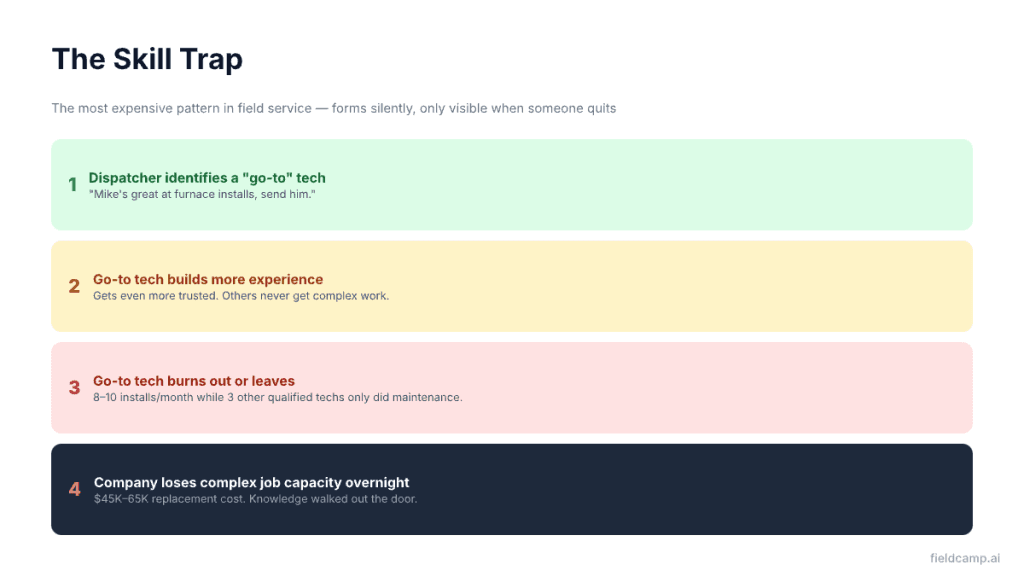
How it forms: A dispatcher identifies a “go-to” tech for complex jobs. That tech builds more experience and becomes even more trusted. Other qualified techs never get complex work and never develop. The go-to tech burns out or leaves. The company loses complex job capacity overnight.
Before: 1 senior tech gets all furnace installs (8–10/month). 3 other qualified techs — all with proper certifications and qualifications — only do maintenance.
After breaking the trap: The system distributes and installs across all 4 qualified techs. Senior tech still gets the hardest diagnostics, but isn’t overloaded. Team capacity increases. Junior techs develop skills. Dependency on a single person disappears.
The skill trap doesn’t just burn out top performers — it wastes capacity you’re already paying for. Mid-level techs who could handle complex work never get the chance. Breaking the trap unlocks existing capacity without hiring.
AI dispatching systems use mathematical approaches to balance workload. Each strategy has strengths and trade-offs.
Jobs rotate through technicians in sequence: Tech 1 gets job 1, Tech 2 gets job 2, and so on. Works when every tech has identical skills and all jobs are roughly equal in complexity. In reality, a 4-hour commercial install shouldn’t count the same as a 30-minute service call.
Assigns jobs based on available hours. If Tech A has 6 hours left and Tech B has 4, the next 3-hour job goes to Tech A. Works well for mixed schedules — part-time techs, staggered start times, on-call rotations. Doesn’t account for job difficulty.
Ensures specialists don’t get 100% of complex jobs. The algorithm tracks certified work separately and distributes it evenly among qualified techs. Essential when you have 2 master plumbers and 3 apprentices — without it, masters handle all complex work and burn out. See how capacity planning with AI impacts your operational level.
Ensures each tech has equal access to high-value jobs. Critical for commission-based teams. The trade-off: pure revenue focus can create inefficient routes — the highest-value job might be 45 minutes away.
Weighs multiple factors simultaneously: effort-adjusted workload, available capacity, skill requirements, revenue potential, and route optimization. You get balanced teams AND optimized routes, not one at the expense of the other. For a deeper dive into how the dispatching algorithms work, see the full technical breakdown.
FieldCamp’s AI dispatch software prevents burnout through mathematical constraints — not dispatcher promises or good intentions.
This is the core mechanism. Think of it as a dial that controls how aggressively the system prevents workload imbalance.
When a new job arrives, the AI job scheduling engine evaluates every possible assignment. For each option, it calculates a score based on travel time, skill match, time window fit, and current distribution. The weight determines how heavily fairness factors into this calculation.
Example: A P0 emergency arrives. Tech A already has 7 jobs. Tech B has 4. Tech A is 8 minutes closer. With workload balancing enabled, the system assigns to Tech B — the additional drive time is an acceptable trade-off to prevent overloading someone already busy.
FieldCamp also includes a dailyWorkloadBalance constraint (default: 1, range: 1–100) that prevents situations where one technician has a light Monday but a crushing Tuesday through Friday.
A technician who had a brutal Monday shouldn’t get another brutal Tuesday. The system remembers and compensates automatically. This connects directly to multi-day scheduling — fair daily distribution is what makes longer-range capacity forecasts reliable.
FieldCamp never schedules technicians to 100% utilization. The system always leaves a buffer for emergencies that arrive mid-day, jobs that run longer than estimated, and traffic delays. This prevents the cascade effect where one overrun destroys the entire day’s schedule.
A morning schedule is a starting point, not a contract. Techs finish early. Others run late. Emergencies arrive at 2 PM. The balanced schedule you built at 6 AM is already wrong by 10 AM.
Real-time rebalancing catches these shifts as they happen — the same mechanism that powers dynamic rerouting.
Trigger: Tech B finishes two jobs faster than expected. Tech A is on track for a 9-hour day.
Without rebalancing: Tech B sits idle for 40 minutes. Tech A pushes into overtime.
With rebalancing: The system detects the gap and reassigns Tech A’s next available job to Tech B. Tech A drops from 9 hours to 7.5. Tech B picks up productive work instead of waiting.
When a P0 emergency arrives, traditional systems assign it to whoever is closest, regardless of current workload. FieldCamp evaluates current job count, remaining capacity, downstream impact on other jobs, and skill match combined with proximity. A technician with 7 jobs won’t automatically receive an emergency when another qualified tech has 4 — even if the busier tech is slightly closer.
Perfect workload balance and minimum drive time don’t always align. Sometimes the most efficient route creates the most unfair distribution.
Example: The North zone has 12 jobs. The South zone has 6. Pure route optimization would overload the North tech and leave the South tech with half the work. Geographically efficient, operationally destructive.
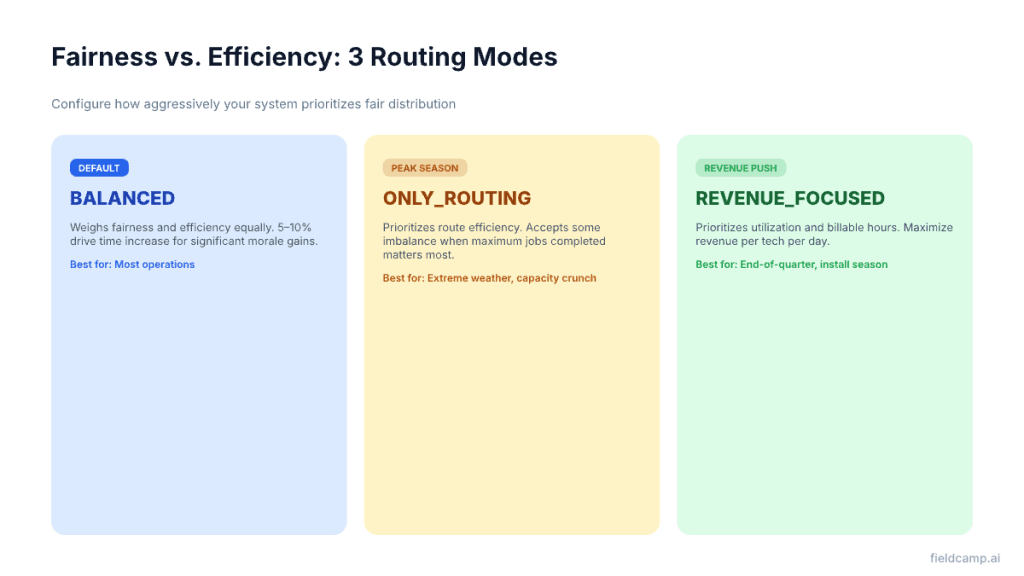
BALANCED (default): Weighs fairness and efficiency equally. Best starting point for nearly every team. Typical drive time increase: 5–10%. Morale impact: significant.
ONLY_ROUTING: Prioritizes route efficiency. Use during extreme weather, high fuel costs, or capacity crunches when maximum jobs completed matters most. See how AI reduces drive time for the full routing mechanics.
REVENUE_FOCUSED: Prioritizes utilization and billable hours. Use for end-of-quarter pushes or high-value installation season. Use the AI dispatcher ROI calculator to see what this means for your numbers.
Busy season (summer HVAC, winter heating): Shift toward efficiency. Every completed job matters, and your team understands the push.
Slow season: Shift toward strict fairness. Use the breathing room to rebuild team morale and show techs their workload is being managed thoughtfully.
Without tracking these metrics, unfairness becomes invisible until someone quits.
1. Job count variance — Standard deviation of daily job counts across your team. Target: under 15%. Red flag: over 25%.
2. Total work hours — Actual job time plus drive time per technician. Target: every tech within 12% of the team average. Red flag: one tech 20%+ over average.
3. Drive time percentage — Percentage of shift spent driving. Target: 20–30% for all techs. Red flag: one tech over 40%, another under 15%. Understanding AI route optimization helps address this imbalance.
4. Revenue per tech — Total billable value assigned. Target: within 12% of team average. Red flag: consistent 25%+ gap.
5. Effort score variance — Composite workload score combining all factors. Target: under 15%. Red flag: over 20%. This is the most accurate single measure of true fairness.
Red bars (above 95% utilization): Tech is at or past capacity. Adding one more job means overtime or quality drops. Immediate action zone.
Green bars (70–90% utilization): Healthy range. Productive without being stretched. This is your target state.
Yellow bars (below 50% utilization): Significant unused capacity. Either not getting enough jobs or finishing faster than estimated. Worth investigating.
Patterns that matter: One red + three yellow = classic favoritism pattern, redistribute immediately. All green = balanced team.
Multiple reds + no yellow = understaffed, not imbalanced. Red trending 3+ days = weekly accumulation building toward burnout.
Good team management software tracks patterns across weeks and flags problems before they impact morale.
Replacing a burned-out technician costs between $45,000 and $65,000 when you factor in recruiting, training, lost productivity, coverage gaps, and the customer relationships that walked out the door. For specialized trades like HVAC or electrical, it runs even higher.
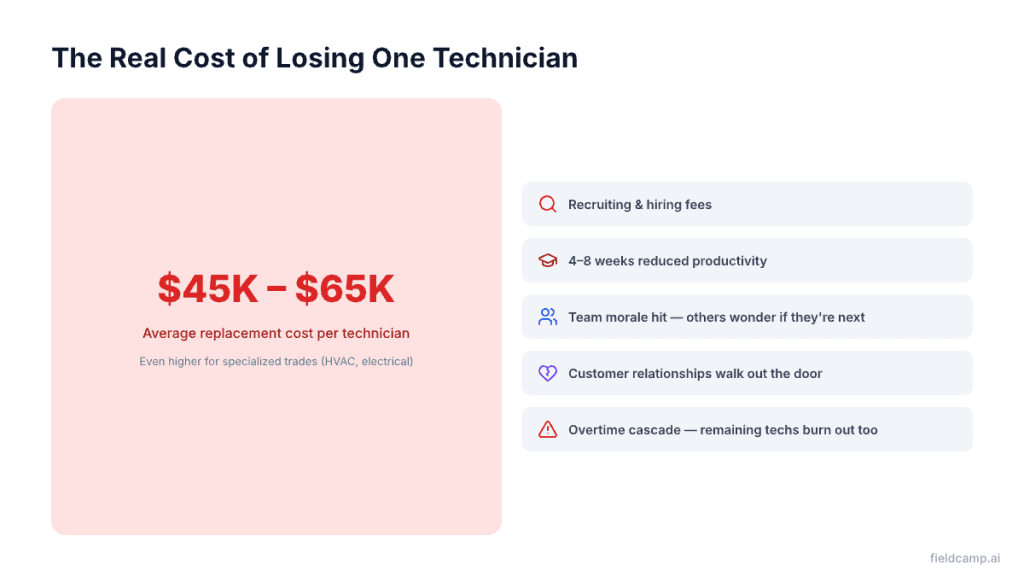
Team morale takes a hit. When one technician leaves due to burnout, others notice. They start wondering if they’re next.
Dispatcher stress increases. Covering gaps with fewer technicians means more complex scheduling under more pressure — accelerating the same patterns that caused the first resignation.
Customer service suffers. New technicians don’t know customer preferences, equipment history, or site-specific details.
Overtime costs spike. Remaining technicians work overtime to cover gaps, which accelerates their own burnout risk. One resignation can trigger a cascade.
HVAC: Summer “No Cool” and winter “No Heat” emergencies create sustained high-pressure periods where your best techs get hammered. Check the latest HVAC industry trends to see how this pressure is growing.
Plumbing: Winter pipe freezes create sudden demand spikes. Summer construction season creates sustained high volume.
Electrical: Permit-dependent backlogs create unpredictable clustering. When permits clear, everything hits at once.
AI dispatch costs a fraction of a technician replacement. When you prevent even one resignation through fair distribution, you’ve saved many times the annual software cost. For help calculating this for your specific operation, use the AI dispatcher ROI calculator.
Not every AI decision should stand. Override when:
Don’t override to “help out” your busiest tech by giving them one more job; that’s how the skill trap forms. Every override is tracked, and the system compensates in subsequent scheduling.
Learn more about how to manage a field service team effectively while balancing overrides with automation.
See how FieldCamp’s automation balances workload across your team, without manual intervention.
The process of measuring, distributing, and monitoring job assignments so no single tech absorbs a disproportionate share of the work. It accounts for job count, total hours, complexity, drive time, and revenue — not just how many stops someone has.
A tech with 5 complex commercial installs (8 hours) is more overloaded than a tech with 8 routine inspections (4 hours). Job count treats a 15-minute filter swap the same as a 4-hour furnace replacement.
Volume inequality (unequal job counts), complexity clustering (hard jobs funneled to one person), and geographic unfairness (unequal drive distances). All three can happen simultaneously.
Through mathematical constraints that enforce fair distribution on every scheduling decision. The system tracks workload across multiple dimensions and compensates automatically — a tech who had a heavy Monday gets a lighter Tuesday.
When one “go-to” technician gets all complex jobs because the dispatcher trusts them most. Other qualified techs never develop. The go-to tech burns out or leaves, and the company loses complex job capacity overnight.
It’s a configurable weight (1,000–10,000, default 5,000) that tells the AI how aggressively to prioritize fair distribution. Higher weight means stricter fairness enforcement, even at the cost of slightly longer routes.
Between $45,000 and $65,000 when you factor in recruiting, training, lost productivity, coverage gaps, and lost customer relationships. For specialized trades, it can run higher.
Depends on your business. Residential teams where techs see each other daily should prioritize fairness (weight 7,500–10,000). Commercial operations where efficiency drives margins can lean toward efficiency (3,000–5,000). Most teams run balanced mode.
Five key metrics: job count variance (under 15%), total work hours (within 12% of team average), drive time percentage (20–30% for all), revenue per tech (within 12%), and composite effort score variance (under 15%).
When conditions change mid-day — a tech finishes early, another runs late, an emergency arrives — the system automatically redistributes jobs to maintain balance. A tech who was heading for a 9-hour day drops to 7.5 as surplus jobs shift to someone with capacity.