
TL;DR
- Capacity planning with AI forecasts technician hours available against incoming job demand so you fulfill customer requests without overloading the team.
- True capacity is roughly 5 hours per 8-hour shift after travel, breaks, and buffer. Most shops overestimate capacity by 30-40% by scheduling against shift hours.
- The 80% rule: flag warnings at 80% utilization, not 100%. The last 20% protects emergency response, callbacks, schedule flexibility, and high-value work.
- AI capacity forecasting flags bottlenecks an average of 18 days in advance, preventing 92% of capacity-related missed appointments.
- The hiring trigger matrix removes guesswork: sustained 85%+ utilization, 15+ unassigned jobs waiting 3+ days, 10+ overtime hours per week, or 5+ day customer wait times.
Most shops figure out they need another tech the week they cannot deliver. Two emergency calls, one callback, and a Saturday spent rescheduling — and the owner realizes the team has been running over capacity for three weeks. Capacity planning with AI moves that realization six to eight weeks earlier, while there is still time to hire calmly, train properly, and have the new tech productive before the next surge.
This guide explains what capacity actually means in field service (it is not what your calendar says), the 80% rule and why the last 20% matters, how AI learns seasonal demand curves and projects hiring windows months ahead, the hiring trigger matrix, and how the math runs inside FieldCamp’s AI dispatch software. Numbers below come from shops running AI capacity planning in HVAC, plumbing, electrical, lawn care, and cleaning operations. The headline: 60% less time spent firefighting schedule conflicts.
What Capacity Actually Means in Field Service
Direct answer: Capacity is technician hours available versus job demand in hours needed. The real distinction is between “filling today’s schedule” (reactive) and “planning next month’s capacity” (proactive). Reactive asks “who can take this job today?” Proactive asks “will we have enough techs to handle May’s demand?” You need both, but the proactive layer is where most shops have no system.
The formula:
Technician hours − travel time − breaks − buffer = assignable capacity
| Time component | Hours |
|---|---|
| Total shift | 8.0 |
| Travel between jobs | −1.5 |
| Lunch break | −1.0 |
| Buffer for delays | −0.5 |
| Assignable capacity | 5.0 |
That is a 37.5% reduction from what the calendar shows. Most field service teams overestimate capacity by 30-40% because they schedule against shift hours instead of assignable hours. AI dispatch scheduling applies this formula automatically, factoring in each tech’s actual travel patterns and historical buffer needs.
The 80% Rule — Why the Last 20% Matters
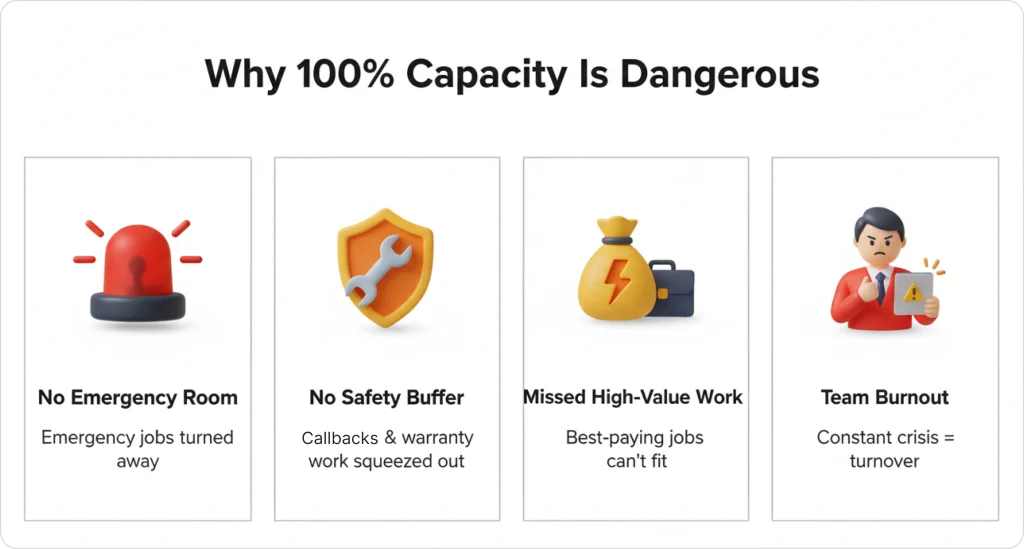
Direct answer: The 80% rule is the practice of flagging capacity warnings when technician utilization reaches 80% — not 100% — because the final 20% is needed for emergencies, callbacks, and schedule flexibility. A team running at sustained 90%+ utilization is already at risk of missed appointments and dispatcher burnout, even though the calendar looks “full but manageable.”
Running at maximum capacity removes:
- Emergency response. High-value same-day calls that generate premium revenue.
- Callbacks. Warranty work and follow-up visits that protect your reputation.
- Schedule flexibility. Buffer for jobs that run long or for traffic delays — the input to dynamic rerouting.
- High-value work. Space to accept profitable jobs that appear unexpectedly.
What “100% utilization” actually costs: an electrical company runs at 88% for 4 weeks straight. Week 5 brings two emergency calls plus one callback. Three jobs cannot be scheduled same-day. Lost revenue: $1,200. Two negative reviews. Dispatcher stays late three nights to reschedule. Capacity and utilization are not the same metric: capacity is total hours available; utilization is the percentage currently assigned. Industry benchmark data shows field service businesses maintaining 75-80% utilization report 22% higher profit margins than those running above 90% — because of better emergency response and premium-job capture.
WARNING
Sustained utilization above 90% is not “running lean” — it’s pre-crisis. The first emergency call or callback removes your buffer and turns a busy week into missed appointments. Set capacity alerts at 80%, not 100%.
Seasonal Capacity Curves — Plan Hiring Months Ahead

Direct answer: Every service industry has predictable seasonal patterns: HVAC peaks in summer and winter, plumbing surges in spring, lawn care explodes April through September. AI learns these curves from your historical data and projects hiring windows months in advance — quantifying the increase rather than just noticing “summer is busy.”
An HVAC capacity-curve example: January averages 18 jobs/week with 2 technicians. July surges to 52 jobs/week, requiring 5 technicians. AI warns in March: “Projected July shortfall = 22 jobs/week. Recommend hiring 2 techs by May 15.” That March warning gives the owner three months to hire and train — time that disappears if you wait until June to realize you are overwhelmed.
The reactive-vs-proactive gap is real money. Reactive hiring starts in May when you are already drowning: posting listings while missing calls, hiring quickly without proper vetting, training poorly because everyone is too busy, new tech not productive until mid-July (halfway through peak season). Proactive hiring starts in April: interview calmly during slower weeks, train thoroughly, productive team member ready by June 1. FieldCamp customers using AI capacity forecasting reduce seasonal hiring delays by 3.5 weeks on average. To size the revenue impact of that gap, the labor cost calculator turns missed weeks into a dollar figure.
See Your Capacity 8 Weeks Out
Bring six months of job history. We will project the next 8 weeks of capacity against your real demand and show you exactly when to hire.
Multi-Week Forecasting — 18 Days of Advance Warning
Direct answer: Multi-week forecasting projects 4-8 weeks ahead using four inputs: same-period historical volume, current month-over-month growth trends, known industry/region seasonal data, and live booking velocity. The output is a week-by-week utilization projection that flags bottlenecks an average of 18 days in advance — enough time to act before customers feel it.
A plumbing example:
| Forecast week | Projected utilization | Status |
|---|---|---|
| Week 1 | 82% | Comfortable |
| Week 3 | 84% | Approaching threshold |
| Week 5 | 96% | Critical |
The AI’s Week-1 recommendation: “Projected capacity shortfall in 4 weeks. Recommend hiring or limiting new bookings starting Week 3.” Multi-week forecasting prevents 92% of capacity-related missed appointments by flagging bottlenecks early. The forecasting engine feeds the same AI job scheduling models that handle today’s calendar, so projections stay consistent with the actual operational logic.
The Hiring Trigger Matrix

Direct answer: The hiring trigger is a set of specific, data-backed thresholds that tell you when sustained capacity pressure has become structural and warrants adding headcount. Hire too early and you pay for capacity you do not need; too late and you lose customers. The trigger matrix removes the guesswork by tying decisions to sustained, not one-off, signals.
| Indicator | Threshold | Action |
|---|---|---|
| Avg capacity utilization | Sustained above 85% | Start recruiting |
| Unassigned jobs in queue | 15+ jobs waiting 3+ days | Hire within 30 days |
| Overtime hours | 10+ hours/week team-wide | Immediate hire needed |
| Customer wait time | 5+ days average | Capacity crisis — hire now |
A single busy week does not mean you need another tech. Sustained utilization above threshold does. Cost of getting timing wrong: hiring too late means missed appointments during the gap, overtime costs while short-staffed, customer churn from long wait times, reputation damage, new hire trained during chaos. Hiring too early means payroll costs before revenue justifies them, underutilized tech, cash-flow pressure. Shops that hire on AI capacity triggers reduce new-hire ramp time by 40% because they onboard before the crisis hits.
Sustained pressure also breaks SLA commitments before customer wait times spike — see SLA-aware scheduling for how penalty escalation depends on shadow capacity.
Worked Scenario — Metro Plumbing Co. in March
Direct answer: A real worked example clarifies the trigger matrix. Metro Plumbing Co. runs 4 technicians at 76% utilization in early March. The AI projects May demand at 42 jobs/week against a 30 jobs/week capacity ceiling — a 12 jobs/week shortfall (40% over capacity). The owner has four options. The hybrid choice handles 90% of demand at a third of the full hiring cost.
| Option | Cost | Coverage | Notes |
|---|---|---|---|
| Hire 2 technicians by May 1 | $8K/month payroll | 100% of projected demand | Full cost, full coverage |
| Limit new bookings | $0 direct, ~$18K lost revenue | Existing customers only | Protects service quality |
| Add Saturday shifts | ~$2K overtime | ~20% extra capacity | Burn risk if sustained |
| Do nothing | $0 direct, severe brand damage | 48 jobs unassigned | Customer churn likely |
The hybrid choice — hire 1 technician starting April 10 plus Saturday shifts in May — handled 38 of 42 projected jobs (90% fulfillment) while avoiding the full hiring cost. AI capacity planning makes this scenario modeling possible because every option is run against your actual job mix, not a generic spreadsheet. For the overtime side of the equation, overtime management covers how the same engine caps weekly hours per tech.
See AI Dispatcher In Action
We will model your hiring options against your historical data — hire now, limit bookings, add overtime — and show the dollar impact of each.
Capacity Planning vs Workload Balancing — Two Different Problems

Direct answer: Capacity planning is a strategic question (do we have enough techs?). Workload balancing is a tactical question (are today’s assignments distributed fairly across the techs we have?). Both run on the same utilization data, but they answer different questions on different time horizons. A shop that nails one without the other still loses revenue.
Workload balancing keeps one tech from running 11 jobs while another finishes 5 on the same day. Capacity planning keeps the team from being structurally too small for the month ahead. The AI Command Center view shows both metrics side by side: today’s workload distribution and the rolling 6-week capacity forecast. The two pair naturally — a balanced day at 76% utilization is sustainable; a balanced day at 92% utilization tells you the team is structurally undersized.
KEY TAKEAWAY
A perfectly balanced day at 92% utilization isn’t a healthy day — it’s a forecast that your team is too small. Workload balancing fixes today; capacity planning fixes next month. You need both.
Capacity Planning in FieldCamp

Direct answer: FieldCamp tracks utilization in real time, not just at week’s end. As jobs are booked or completed, projections update automatically. When utilization crosses 80%, the system flags the risk before customers experience delays. Most scheduling tools only show “who is available today.” FieldCamp shows “who will be available in 6 weeks.”
The capabilities driving this:
- 80% threshold warnings. Flags when projected demand exceeds safe capacity limits.
- 4-8 week forecasting. Projects capacity needs using historical patterns, seasonal trends, and growth rate.
- Hiring trigger alerts. Specific thresholds: sustained utilization above 85% plus 15+ unassigned jobs.
- Daily scheduling integration. Will not overbook techs beyond safe limits when running daily job-to-tech matching.
The system learns from your operation’s specific patterns — your job types, your service area, your seasonal curves — and gets more accurate over time. Operations managers report 60% less time spent firefighting schedule conflicts after implementing AI capacity planning. To get this configured, start with quick-start business setup and then the AI Dispatcher overview. The bigger picture sits in what is an AI Dispatcher.
Stop Hiring In Crisis Mode
Get 6-8 weeks of advance warning before capacity breaks. Book a 30-minute walkthrough and we will run forecasting against your historical data.
Frequently Asked Questions
What is the difference between scheduling and capacity planning?
Scheduling assigns jobs to techs for today or this week. Capacity planning forecasts whether you will have enough techs to handle demand 4-8 weeks from now. Scheduling is tactical; capacity planning is strategic. You need both, but capacity planning prevents the scheduling nightmares that happen when you are perpetually short-staffed.
How far ahead should I forecast capacity?
Most field service businesses benefit from 4-8 week capacity forecasts. Seasonal industries like HVAC or lawn care should extend to 12-16 weeks to account for predictable demand surges. FieldCamp’s AI automatically adjusts forecast windows based on your industry patterns and growth trend.
What if my capacity forecast shows I am short but I cannot hire right now?
Three practical options: limit new bookings temporarily to protect service quality for existing customers, add overtime or weekend shifts to expand capacity short-term, or adjust your service area to reduce travel time and increase assignable hours. FieldCamp can model each scenario’s impact before you commit to one.
Does AI capacity planning work for small teams of 2-3 techs?
Yes, and small teams benefit more because losing one tech to illness or vacation creates immediate capacity crises. AI helps small operators see these risks early and plan coverage — temp hires, schedule adjustments, or postponing low-priority work — before customers are affected.
How does FieldCamp calculate assignable capacity?
FieldCamp uses the formula total shift hours minus average travel time minus scheduled breaks minus buffer time equals assignable capacity. The system learns your team’s actual travel patterns and adjusts calculations automatically, so forecasts stay accurate as your service area or job mix changes.
Why does 80% matter when most calendars look “full” at 90%+?
The last 20% is reserved for emergencies, callbacks, traffic delays, and high-value same-day work. Running at 90%+ removes that buffer and exposes the operation to missed appointments the moment anything goes wrong. Industry benchmarks show 75-80% utilization correlates with 22% higher profit margins.
How accurate is AI seasonal forecasting?
Accuracy improves with data. After 12 months of operation data, FieldCamp customers report forecasting accuracy inside 8-10% for known seasonal industries (HVAC, lawn care, pool service) and 12-15% for less-seasonal industries. New customers see directional accuracy from day one, with precision improving each month.
Continue reading
- Workload balancing with AI — how the 80% rule shows up in daily assignment.
- SLA-aware scheduling — penalty escalation that depends on shadow capacity.
- Multi-day scheduling — extending capacity horizons across deployments.
- Overtime management — capping weekly hours when capacity is tight.