Fair Distribution Algorithms: How AI Dispatching Balances Workload Across Your Team
Your best technician just quit. When you asked why, he said: “I’m tired of getting all the hard jobs while everyone else coasts.”
Sound familiar?
This happens more often than most contractors realize. And the frustrating part?
The dispatcher didn’t mean to play favorites. They were simply trying to get the job done.
What is fair distribution in AI dispatching?
Fair distribution is the algorithmic process of balancing workload across technicians based on effort, complexity, and capacity, not just job count. In AI dispatching, this means a technician assigned 5 complex jobs with long drive times may have a heavier workload than another tech with 8 simple maintenance calls. Modern fairness algorithms calculate composite workload scores that account for job duration, drive time, and skill requirements to ensure no single tech becomes consistently overloaded.
Manual dispatching creates invisible favoritism. Your experienced techs get overloaded because they’re reliable. Your newer techs sit idle because it feels risky to send them on tough calls. Nobody tracks the imbalance until someone burns out or walks out the door.
Fair distribution algorithms in AI dispatching balance workload through five strategies, weigh competing priorities, and surface the metrics dispatchers need before favoritism becomes turnover.
Why Job Count Doesn’t Equal Fair Distribution
Most dispatchers naturally count jobs when assessing workload. It seems logical, if Tech A has 8 jobs and Tech B has 8 jobs, they’re equally loaded, right?
Not even close.
Two technicians with identical job counts can have wildly different workloads. The difference lies in what those jobs actually require.
The Effort Unit Concept
AI dispatching systems calculate true workload using a composite measure that accounts for multiple factors. Think of it as a “real effort” score rather than a simple job tally.
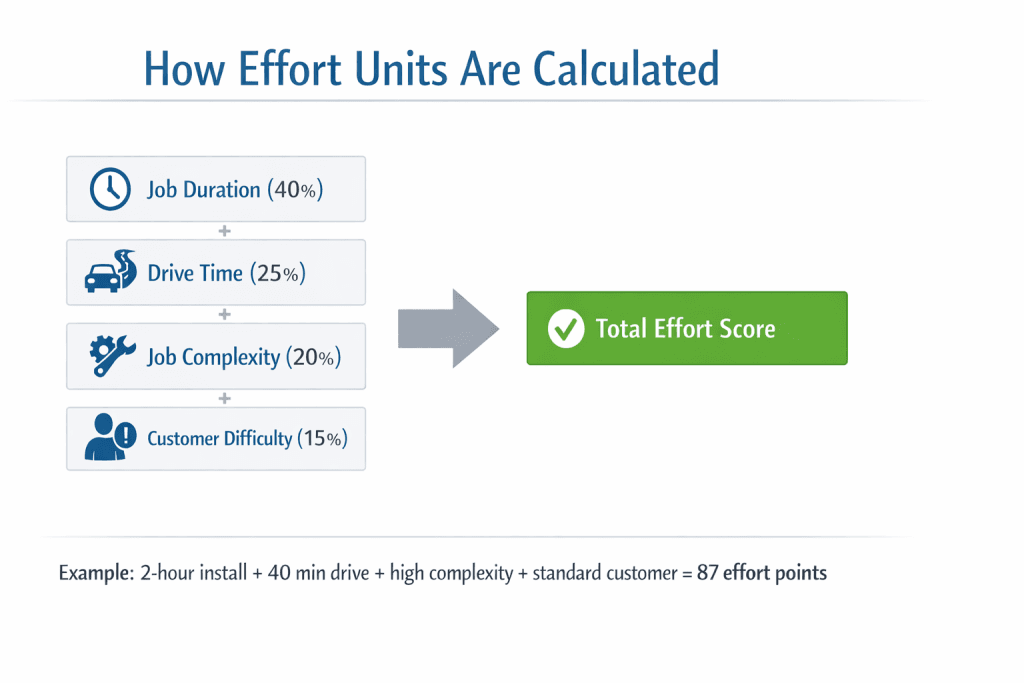
Here’s what goes into it:
Job duration matters most. A 3-hour commercial install weighs more than a 45-minute filter change, obviously. But dispatchers juggling 20+ jobs can’t keep these differences in their heads.
Drive time adds up fast. Forty minutes between jobs adds fatigue and eats into productive time. A tech who drives 3 hours total has a harder day than one who drives 45 minutes, even with the same number of stops.
Job complexity drains mental energy. Diagnostic work, where the tech has to figure out what’s wrong, requires more focus than routine maintenance, where they already know the steps.
Customer difficulty is real. Some customers need extra explanation, multiple approvals, or complicated access coordination. These jobs take longer than the work order suggests.
A Real Scenario
Consider this example from an HVAC software company with two technicians:
Tech A’s Day:
- 8 residential maintenance calls
- Average job time: 45 minutes each
- Average drive time: 12 minutes between jobs
- Total work hours: roughly 7.5 hours
Tech B’s Day:
- 8 commercial jobs
- Average job time: 2 hours each
- Average drive time: 25 minutes between jobs
- Two difficult customers requiring callbacks
- Total work hours: roughly 11 hours
Same job count. Completely different workload.
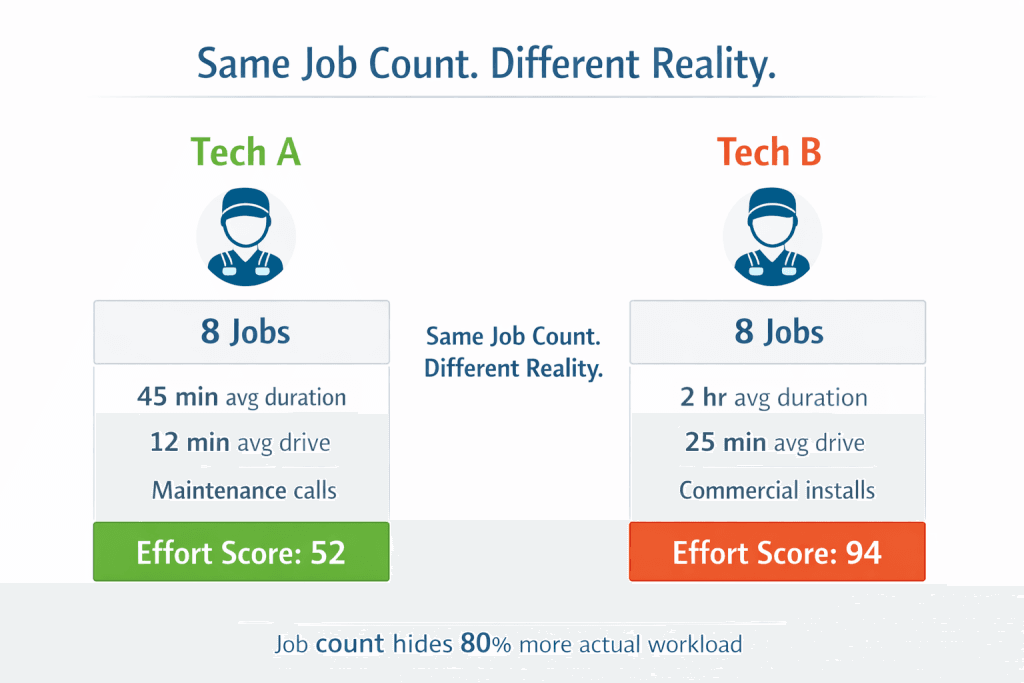
When this pattern repeats week after week, Tech B burns out while Tech A wonders why their colleague seems stressed all the time. The dispatcher never meant to create this imbalance; they just couldn’t see it.
Why Manual Dispatchers Miss This
Dispatchers are already managing location, skills, availability, and customer time windows. They can’t simultaneously track drive time accumulation, complexity weighting, and multi-week workload patterns across 8 or more technicians.
For more on why this complexity overwhelms manual processes, see our guide to how AI dispatcher algorithms work.
So dispatchers fall back on mental shortcuts that feel efficient in the moment:
“Send whoever is closest.”
“Give the commercial jobs to Mike, he’s good at them.”
“Drop emergencies on whoever frees up first.”
These shortcuts work for individual dispatches but create systematic unfairness over time. Mike keeps getting commercial jobs because he’s good at them, which means Mike is always exhausted, which means Mike eventually quits.
The Five Fairness Distribution Strategies
AI dispatching systems use mathematical approaches to balance workload. Each strategy has strengths and trade-offs depending on your team structure and what matters most to your business.
| Strategy | How It Works | Best For | Limitation |
| Round-robin | Rotates assignments 1-2-3-1-2-3 | Teams with identical skills | Ignores job complexity |
| Capacity-based | Fills available hours evenly | Mixed shift schedules | Doesn’t account for difficulty |
| Skill-weighted | Balances certified vs. general work | Specialized teams | Can still overload specialists |
| Revenue-balanced | Equalizes commission potential | Sales-driven service teams | May sacrifice route efficiency |
| Hybrid | Weighs all factors simultaneously | Real-world operations | Requires initial tuning |
Let’s break down when each one makes sense.
Round-Robin Distribution
The simplest approach. Jobs rotate through technicians in sequence: Tech 1 gets job 1, Tech 2 gets job 2, and so on.
This works when every tech has identical skills, and all jobs are roughly equal in complexity.
In reality? A 4-hour commercial install shouldn’t count the same as a 30-minute service call, so pure round-robin creates its own imbalances.
Capacity-Based Distribution
This strategy assigns jobs based on available hours. If Tech A has 6 hours left in their shift and Tech B has 4 hours, the next 3-hour job goes to Tech A.
Capacity-based distribution works well for teams with mixed schedules, part-time techs, staggered start times, or on-call rotations. The limitation is that it doesn’t account for job difficulty.
A tech might have 6 hours available but get assigned three brutal diagnostic jobs while another tech coasts through simple maintenance.
See how capacity planning with AI works and how it impacts your operational level.
Skill-Weighted Distribution
Specialized work creates natural imbalances. If you have 2 master plumbers and 3 apprentices, the masters handle all gas line work, backflow certifications, and complex diagnostics by necessity.
Skill-weighted distribution through AI job scheduling ensures specialists don’t get 100% of complex jobs. The algorithm tracks certified work separately and distributes it evenly among qualified techs, so your masters split the hard stuff rather than one person drowning while the other catches a break.
Revenue-Balanced Distribution
For commission-based teams, job count and work hours matter less than earning potential. Revenue-balanced distribution ensures each tech has equal access to high-value jobs.
This works for sales-driven service teams where technicians earn commission on upsells or installations. The trade-off is that pure revenue focus can create inefficient routes; the highest-value job might be 45 minutes away when a lower-value job is 5 minutes away.
Hybrid Distribution
Real operations can’t optimize for just one factor. That’s why hybrid models weigh multiple factors simultaneously: effort-adjusted workload, available capacity, skill requirements, revenue potential, and route optimization.
Operations managers can configure how aggressively the system balances each factor.
Need strict fairness because your team is complaining? Increase the workload balance weight. Prioritizing route efficiency during the busy season? Adjust accordingly.
The hybrid approach typically reduces workload variance significantly across teams while still maintaining reasonable routes.
When Should Daily Fairness Flex for Business Reasons?
Mathematical fairness sometimes conflicts with operational reality. Smart AI dispatching systems recognize scenarios where the daily balance should flex for legitimate business reasons.
Here’s the key difference: manual dispatching creates invisible favoritism that accumulates over weeks. AI dispatching creates visible, tracked exceptions that balance out over time.
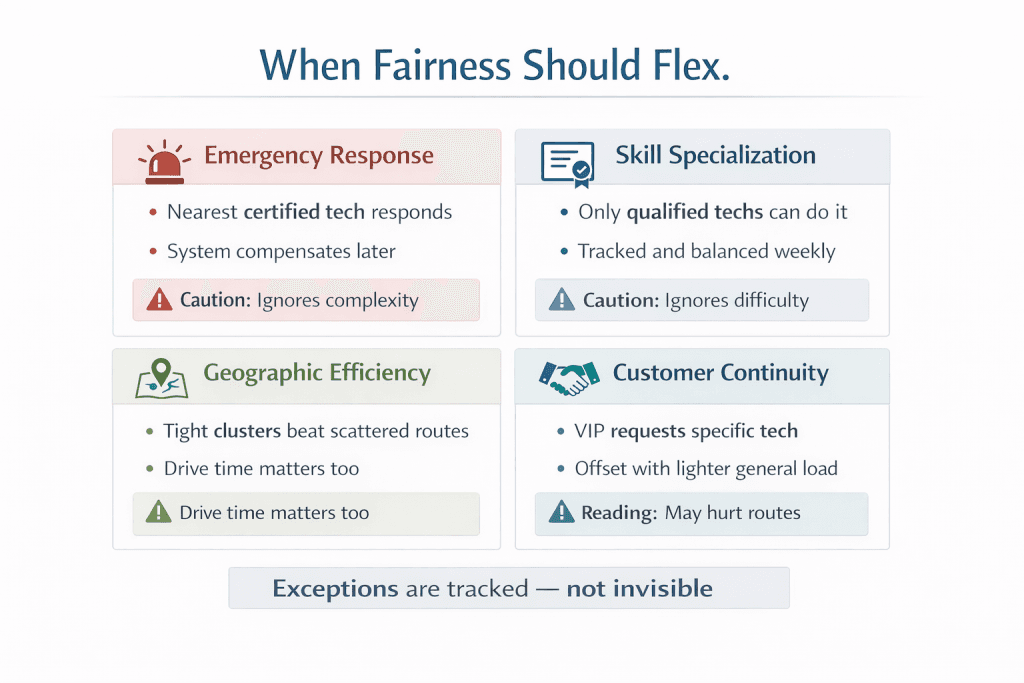
Emergency Response
A gas leak at 2 PM requires the nearest certified technician, even if they already have 7 jobs scheduled. Safety and SLA compliance override daily balance, and they should.
In emergency response scenarios, assignments intentionally violate daily fairness to prioritize customer safety and response time. The system tracks this and compensates later.
To understand how AI weighs these competing priorities, see our guide on how AI dispatching thinks.
Skill Specialization
Some work can only go to specific technicians. If you have one EPA-certified tech and three refrigerant recovery jobs come in, that tech gets all three regardless of their current workload.
The difference with AI is that the system remembers. Tech A handled heavy, specialized work on Monday, so Wednesday’s schedule automatically lightens their general workload to compensate.
Geographic Efficiency
Tech B lives in a suburban area with 40% of your customer base. They naturally get 10 jobs, while Tech C in a rural zone gets 6 jobs. But total drive time might be identical, Tech B’s jobs are clustered while Tech C’s are spread across the county.
This is the fairness paradox: 5 complex jobs in a tight cluster can be “more fair” than 8 simple ones scattered across your service area when you account for the full picture. Understanding multi-stop route planning helps explain why job count alone is misleading.
Customer Relationship Continuity
VIP customers sometimes request specific technicians. Mrs. Johnson wants Mike because he’s serviced her HVAC system for three years. Overriding this preference damages customer relationships.
Smart systems honor these preferences while tracking the impact. If Mike consistently gets VIP requests, the system compensates by giving him lighter general assignments so the total workload stays balanced.
What Metrics Should Dispatchers Track for Fair Distribution?
Without tracking these five metrics, unfairness becomes invisible until someone quits.
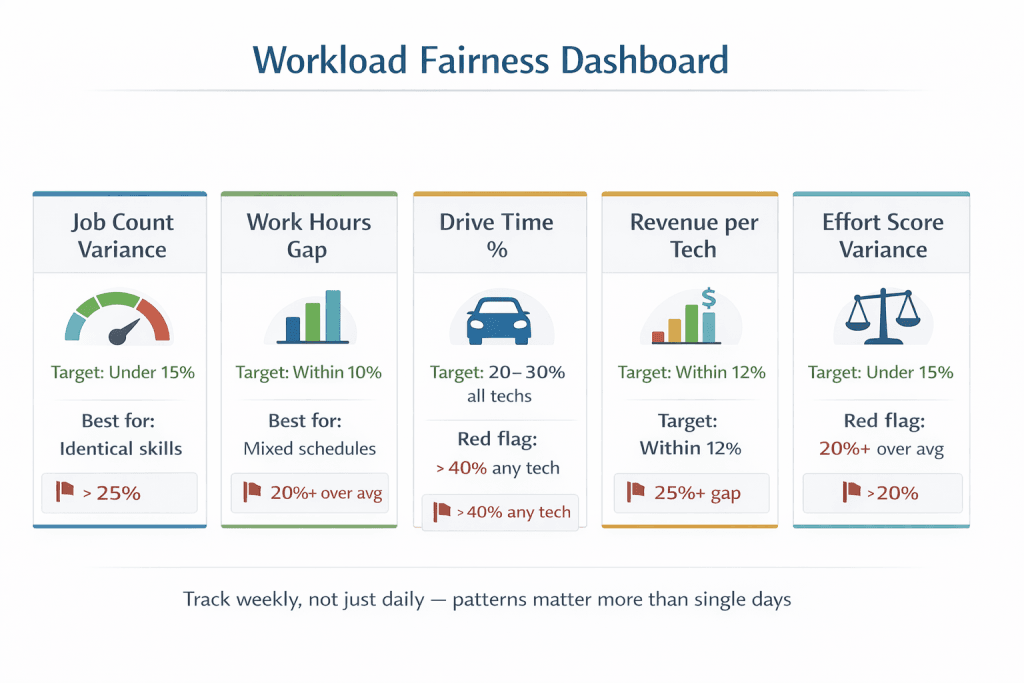
| Metric | What It Measures | Target Range | Red Flag |
| Job count variance | Standard deviation of daily job counts | Under 15% | Over 25% |
| Total work hours | Actual job time + drive time | Within 12% of the team average | One tech 20%+ over average |
| Drive time percentage | Percentage of shift spent driving | 20–30% for all techs | One tech over 40%, another under 15% |
| Revenue per tech | Total billable value assigned | Within 12% of team average | Consistent 25%+ gap |
| Effort score variance | Composite workload score | Under 15% | Over 20% |
Let’s look at each one and why it matters.
Job Count Variance
The simplest metric, but also the most misleading in isolation. Track standard deviation across your team. If one tech consistently gets 10 jobs while another gets 6, investigate why.
The target is less than 15% variance in daily job counts.
Total Work Hours
This includes actual job time plus drive time. A tech with 8 jobs might work fewer hours than a tech with 6 jobs if those 6 are complex and spread across your service area. Target: every tech within 10% of the team average.
Drive Time Distribution
Excessive driving burns out technicians faster than difficult jobs. If one tech spends 40% of their day driving while another spends 15%, you have a geographic distribution problem. Understanding AI route optimization can help address this imbalance.
Target: 20–30% drive time for all technicians.
Revenue Per Tech
Critical for commission-based teams. Track the total billable value assigned to each technician. Consistent gaps indicate someone, whether dispatcher or algorithm, is playing favorites with high-value jobs. Target: within 12% of team average.
Effort Score Variance
A composite score that combines all factors into a single workload metric. This is the most accurate measure of true fairness because it accounts for everything, not just one dimension. Target: less than 15% variance across the team.
Multi-Week Tracking Matters Most
Daily imbalance is acceptable. Even expected. Emergencies happen. Specialists handle specialized work. Geographic clustering makes sense.
The problem is patterns. If Tech A has heavy Mondays every week for a month, that’s systematic unfairness. Good team management software tracks patterns across weeks and flags problems before they impact morale.
How FieldCamp Eliminates the “Favorite Tech” Problem
Manual dispatching creates invisible bias. Dispatchers naturally favor technicians they trust, creating a self-reinforcing cycle: reliable techs get more work, prove themselves reliable, and get even more work until they burn out.
FieldCamp’s AI dispatcher eliminates this bias through mathematical constraints.
Dispatcher Bias Elimination
The algorithm assigns based on skills, location, and workload data, not dispatcher preferences. It doesn’t know that Mike is the dispatcher’s brother-in-law or that Sarah complained about a job last week. It only sees skills and certifications, current location, current workload, time window requirements, and historical performance data.
Personal relationships, unconscious preferences, and “gut feelings” don’t factor into the equation.
Multi-Day Fairness Tracking
The system remembers cumulative workload across weeks, not just today. If Tech B had three commercial installs on Monday, Wednesday’s schedule automatically lightens their load. Most dispatchers can’t track this mentally across a full team, but the algorithm never forgets.
Configurable Fairness Weights
Operations managers can tune how aggressively the system balances workload. The technician workload balance constraint actively penalizes schedules that create significant variance, pushing the solver to redistribute jobs more evenly.
Strict fairness mode: Higher weight means the system works harder to equalize workload, even if it means slightly longer routes.
Flexible mode: Lower weight allows more variance when route efficiency or customer preferences conflict with a perfect balance.
Real-Time Workload Visibility
FieldCamp’s dashboard shows the current composite workload for every technician. Dispatchers see overload developing before the end of the day, not after a tech complains or quits.
The system flags when any technician significantly exceeds team’s average for multiple consecutive weeks, giving managers time to intervene before it becomes a resignation letter.
The 80% Capacity Rule
FieldCamp never schedules technicians to 100% utilization. The system always leaves a buffer for emergencies that arrive mid-day, jobs that run longer than estimated, and traffic delays or unexpected complications.
This buffer prevents the cascade effect where one overrun destroys the entire day’s schedule and leaves your last customer waiting until 7 PM.
What Makes This Different
Unlike basic round-robin systems, FieldCamp’s hybrid model weighs fairness against route efficiency, customer SLAs, and skill requirements simultaneously.
You get balanced teams AND optimized routes, not one at the expense of the other.
Teams using workload variance tracking typically catch burnout patterns early, which directly impacts retention. When techs see that workload is being distributed fairly, the “why does Mike always get the easy jobs?” complaints disappear. To understand the business impact, see our AI dispatcher ROI analysis.
For more on how constraint programming enforces these rules, see our guide comparing AI dispatching vs traditional dispatch software.
How to Balance Fairness and Efficiency
Here’s the uncomfortable truth: perfect fairness and perfect efficiency are competing goals. Understanding this trade-off helps you configure AI dispatching for what actually matters to your business.
The Trade-Off
Perfect fairness might mean longer routes as jobs get redistributed away from geographic clusters, higher fuel costs, and fewer jobs completed per day.
Perfect efficiency might mean one tech overloaded in a dense zone, specialists handling 100% of certified work, and geographic techs getting disproportionate job counts.
Neither extreme works. The goal is to find the right balance for your operation.
How AI Navigates This Balance
FieldCamp uses configurable routing modes:
BALANCED (default): Weighs fairness and efficiency equally. Best for most operations and the right starting point for nearly every team.
ONLY_ROUTING: Prioritizes route efficiency. Travel time weight increases significantly. Use during extreme weather, high fuel costs, or capacity crunches when you need maximum jobs completed.
REVENUE_FOCUSED: Prioritizes utilization and billable hours. Workload balance weight increases. Use when maximizing revenue matters more than perfect geographic efficiency.
When to Use Each Mode
Use ONLY_ROUTING when:
- Fuel costs spike significantly
- Extreme weather requires faster customer response
- Technician call-out during peak season creates a capacity shortage
Use BALANCED mode when:
- Normal daily operations
- Team morale is a priority
- Workload variance has been flagged as a concern
Use REVENUE_FOCUSED when:
- End-of-quarter revenue push
- High-value installation season
- Commission team requests more earning opportunities
Real-World Example
A tree service company during storm season faces a choice:
Efficiency mode: Assigns all north-side jobs to Tech A (who lives there), creating 12 jobs vs. Tech B’s 7. But total drive time drops significantly, and customers get a faster response.
Balanced mode: Redistributes some north-side jobs to Tech B, evening the count but adding 45 minutes of drive time to the day.
During emergencies, efficiency mode makes sense; customers need help fast. During normal operations, balanced mode prevents the burnout that leads to turnover.
Seasonal Adjustments
Smart operations adjust fairness settings with the seasons:
Busy season (summer HVAC, winter heating): Shift toward efficiency. Every completed job matters, and your team understands the push.
Slow season: Shift toward strict fairness. Use the breathing room to rebuild team morale and show techs their workload is being managed thoughtfully.
Conclusion
When your best technician says, “I’m tired of getting all the hard jobs,” the problem isn’t their attitude; it’s the invisible workload imbalance that’s been building for months.
AI dispatching makes that imbalance visible through composite workload scores and variance tracking. Then it automatically corrects the problem before burnout happens. The result is teams that stay intact through busy seasons and techs who feel their effort is recognized and distributed fairly.
Track variance, total hours, drive time, and revenue balance, not just job counts. Daily imbalance is acceptable and sometimes necessary. Weekly patterns that consistently overload the same technicians are not.
Understanding fairness algorithms is one piece of keeping your team healthy. Next, learn how AI uses these same principles to actively prevent technician burnout over weeks and months, before your best people start looking elsewhere.
Balance Workloads Automatically
Let AI distribute jobs fairly while you focus on customers. No spreadsheets, no manual tracking required.
Frequently Asked Questions
How does AI prevent the “favorite tech” problem?
AI dispatching removes human bias from the equation by assigning jobs based purely on data: skills, location, current workload, and time windows. The algorithm doesn’t know which tech is the dispatcher’s favorite or who complained about a difficult customer last week. It also tracks multi-day patterns automatically, so if someone had a heavy Monday, their Wednesday gets lighter without anyone having to remember or advocate for themselves.
What metrics should I track to measure fair workload distribution?
Focus on five metrics: job count variance (target under 15%), total work hours including drive time (within 10% of team average), drive time percentage (20–30% for everyone), revenue per tech for commission teams (within 12%), and composite effort score (under 15% variance). The most important insight is tracking patterns over weeks; daily imbalance is fine if weekly and monthly totals balance out.
When should fairness be sacrificed for efficiency?
Fairness should flex for genuine emergencies like gas leaks, where the nearest certified tech responds regardless of current load. It should also flex for safety-critical work that only qualified techs can handle, extreme weather events where customer response time matters most, and geographic clustering during high fuel cost periods. The difference is that AI tracks these exceptions and compensates later, while manual dispatching lets imbalances accumulate invisibly.
How are effort scores calculated?
Effort scores combine multiple factors into a single workload measure: job duration, travel time between stops, job complexity based on type and requirements, and historical data about how long similar jobs actually take. A 2-hour HVAC install in extreme heat scores higher than a 2-hour maintenance call in mild weather because the real-world effort is different. This ensures workload balance reflects actual effort, not just clock time.