Field Service Metrics: Find Your Business’s Match
May 23, 2025 - 34 min read

May 23, 2025 - 34 min read

| TL;DR Tracking the right field service metrics is key to improving efficiency and service quality. This blog breaks down 51 essential KPIs across customer experience, technician productivity, operations, and financial health. With tools like FieldCamp, you can automate metric tracking and drive smarter field service performance in 2026. |
Field service metrics are more than just numbers—they’re the heartbeat of your field service operations. From tracking response times to measuring first-time fix rates, these key performance indicators (KPIs) reveal how efficient, responsive, and customer-centric your team is.
In today’s AI-driven field service optimization landscape, these metrics don’t just guide improvements—they power predictive decisions, smart scheduling, and technician performance. Whether you’re struggling with low productivity or aiming to improve customer satisfaction, these field service KPIs are your roadmap to success.
KEY HIGHLIGHTS
51 KPIs to Optimize Field Service Smarter
Field service metrics are quantifiable data points that help businesses measure the performance, productivity, and effectiveness of their field service operations. These metrics offer insights into how well technicians perform, how quickly and efficiently jobs are completed, and how satisfied customers are with the service.
Examples include first-time fix rate, average response time, travel time between jobs, and customer satisfaction scores. When tracked consistently, these KPIs enable data-driven decisions that lead to better field service management and operational outcomes.
Your Metrics Won’t Track Themselves
FieldCamp quietly runs in the background to auto-track jobs, monitor technician movements, and measure KPIs in real time. Your field ops stay sharp—even when you’re not watching.
Tracking field service KPIs manually using spreadsheets or disconnected systems often leads to outdated data, missed insights, and team misalignment. To get the full picture in real-time, you need a system that captures performance at every step of your workflow, automatically.
That’s where FieldCamp comes in. It simplifies metric tracking by logging technician activities, response times, job completion rates, and customer feedback—all in one place. From the moment a job is scheduled to the time it’s invoiced, FieldCamp captures the data you need to measure performance, spot inefficiencies, and make smarter decisions. Plus, with real-time dashboards and visual reports, you don’t just track metrics—you act on them.
Want to turn raw data into real insights? FieldCamp makes it easy. Let’s get started for FREE.
While often used interchangeably with Key Performance Indicators (KPIs), it’s helpful to understand the subtle distinction:
Think of it this way: all KPIs are metrics, but not all metrics are KPIs. Metrics give you a granular look at your operations, while KPIs offer a bigger-picture view of your business’s health and trajectory.
Tracking field service metrics is essential for optimizing team performance, reducing operational costs, and improving customer satisfaction. Without clear data, businesses rely on guesswork, leading to scheduling delays, unresolved issues, and dissatisfied clients.
By consistently monitoring KPIs, companies can:
In short, these metrics are the foundation of effective field service optimization and sustainable business growth.
Power Up Your Performance
Use FieldCamp’s built-in analytics dashboard to identify weak spots, monitor KPIs in real-time, and make faster, smarter decisions.
Choosing the right field performance metrics starts with understanding your business goals. Different teams and industries prioritize different KPIs depending on the services they offer, their customer base, and their scale of operations.
Here’s a simple 3-step framework to guide you:
1. Align Metrics with Goals
Are you focused on cutting costs, improving response times, or boosting customer satisfaction? Choose metrics that reflect those outcomes.
2. Prioritize Actionable Data
Pick KPIs you can actually improve upon—like job completion time, not just overall revenue. Metrics should lead to operational actions, not just reports.
3. Use AI and Automation Tools
Tools like FieldCamp help automate metric tracking, giving you real-time insights for smarter scheduling, route planning, and technician performance evaluation.
Customer Satisfaction & Experience Metrics (Your Customer’s Happiness Report Card)
These metrics directly tell you how happy your customers are and how well you’re meeting their expectations. Happy customers lead to repeat business and positive word-of-mouth!
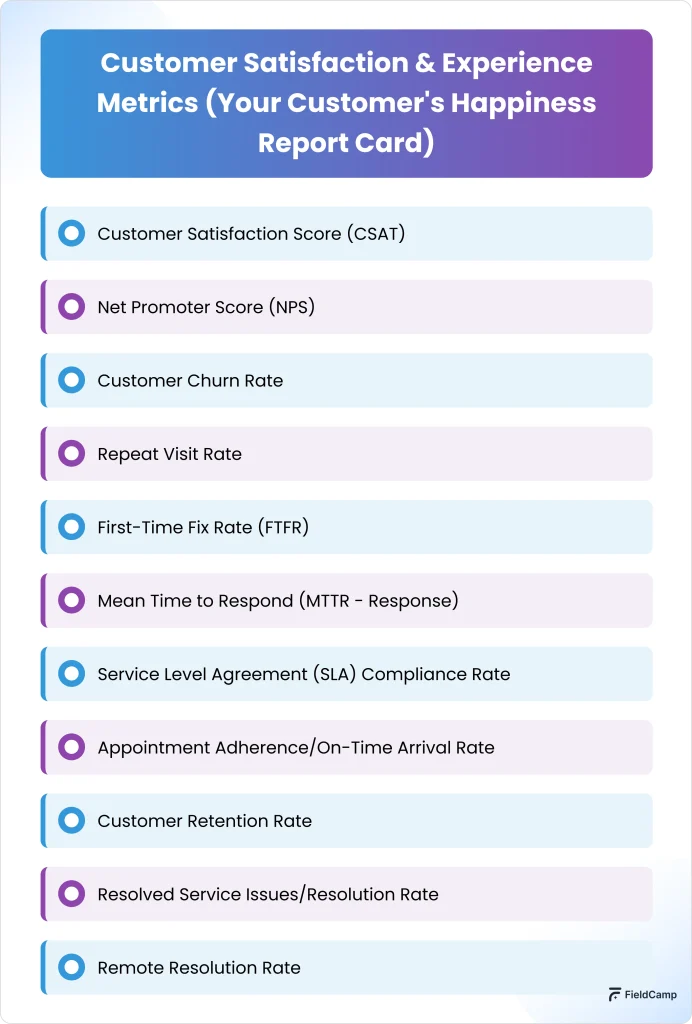
What it is: Measures how satisfied customers are with a specific service interaction. Usually gathered through a quick survey (e.g., “How satisfied are you with our service today? 1-5 scale”).
What it is: Measures how satisfied customers are with a specific service interaction. Usually gathered through a quick survey (e.g., “How satisfied are you with our service today? 1-5 scale”).
Why it matters: A direct indicator of customer happiness. High CSAT means your service is hitting the mark.
How to use it: Identify trends. If CSAT dips, investigate recent changes in processes, technician performance, or product issues.

What it is: Measures customer loyalty and their likelihood to recommend your service to others (on a scale of 0-10).
Why it matters: A strong predictor of future growth and customer retention. Promoters (9-10) are your advocates, Passives (7-8) are vulnerable, and Detractors (0-6) can damage your reputation.
How to use it: Focus on converting Passives to Promoters and addressing Detractor concerns to reduce churn.

What it is: The percentage of customers who stop using your service over a specific period.
Why it matters: High churn means you’re losing valuable customers. It’s often a direct result of dissatisfaction or unmet needs.
How to use it: Analyze churn reasons. Is it service quality, pricing, or competitor offerings?

What it is: The percentage of jobs that require a follow-up visit within a certain timeframe (e.g., 30 days) due to the same issue.
Why it matters: Every repeat visit costs you money (travel, labor, parts) and frustrates the customer. A high rate suggests underlying problems.
How to use it: Dig into the root causes – is it a training gap, lack of tools, incorrect diagnosis, or bad parts?

FieldCamp equips your technicians with everything they need to get it right the first time, from detailed service instructions and job photos to full repair history. Fewer errors mean fewer repeat visits—and happier customers who don’t need to call twice.
What it is: The percentage of service requests resolved completely on the first technician visit.
Why it matters: This is one of the most critical KPIs for field service technicians. A high FTFR directly correlates with customer satisfaction, technician efficiency, and reduced operational costs. It means you get it right the first time.
How to use it: Invest in technician training, ensure they have the right tools and parts, and improve diagnostic processes. Aim for 80% or higher.

With FieldCamp, technicians walk into every job fully prepared—with job histories reviewed, inventory parts stocked and pre-checked, and service instructions at their fingertips. The result? Fewer follow-ups, faster fixes, and higher first-time resolution rates.
What it is: The average time it takes from when a service request is received until a technician or solution is dispatched/begins to address it.
Why it matters: Customers appreciate quick acknowledgement and initial response, even if the full fix takes time.
How to use it: Optimize your dispatching processes, improve communication, and ensure clear channels for incoming requests.

FieldCamp uses intelligent scheduling and instant dispatching to notify technicians in real time, automatically assigning the closest available team member to the job. By factoring in proximity and availability, FieldCamp drastically reduces response time and gets help on-site faster.
What it is: The percentage of service calls that meet the agreed-upon response, resolution, or uptime targets outlined in customer contracts.
Why it matters: Failing to meet SLAs can lead to penalties, customer dissatisfaction, and damage to your reputation.
How to use it: Monitor closely to ensure your team is consistently meeting contractual obligations. Identify why SLAs are missed (e.g., resource availability, scheduling issues).

What it is: The percentage of times technicians arrive within the promised appointment window.
Why it matters: Punctuality is crucial for customer trust and convenience. Delays frustrate customers.
How to use it: Improve route optimization, account for travel time, and use real-time tracking for accurate ETAs. Communicate proactively if delays occur.

FieldCamp’s built-in route optimization and real-time ETAs ensure your technicians arrive on time, every time. By mapping jobs smartly and minimizing delays, FieldCamp helps your team show up when promised—and your customers take notice.
What it is: The percentage of customers your business keeps over a specific period.
Why it matters: Retaining existing customers is significantly more cost-effective than acquiring new ones. It reflects long-term customer satisfaction.
How to use it: Focus on consistent service quality, proactive communication, and loyalty programs.

What it is: The percentage of customer issues that are successfully resolved.
Why it matters: Shows your ability to actually fix problems and deliver solutions.
How to use it: Track unresolved issues to identify recurring problems, training needs, or gaps in your service capabilities.

What it is: The percentage of service issues resolved without a technician needing to travel to the site (e.g., via phone, video call, or remote diagnostics).
Why it matters: Saves significant travel time and costs, and provides faster resolution for customers.
How to use it: Invest in remote diagnostic tools, comprehensive knowledge bases, and advanced training for your support team.

These metrics reveal about your field service efficiency, right from dispatching to job completion. Improving these can significantly reduce costs and improve service speed.
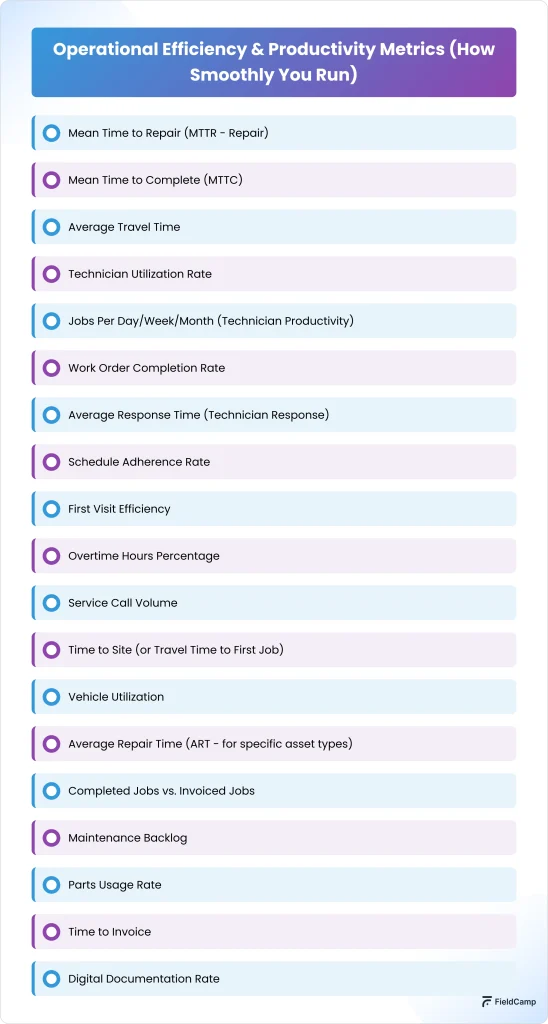
What it is: The average time it takes for a technician to fix an issue once they begin work on it at the customer’s site.
Why it matters: Lower MTTR indicates highly skilled technicians, efficient diagnostic processes, and quick access to parts.
How to use it: Provide advanced training, ensure technicians have digital access to manuals and knowledge bases, and optimize parts inventory.

What it is: The average total time from when a service request is received until the job is fully completed (including travel, repair, and paperwork).
Why it matters: A comprehensive measure of overall service delivery speed. A high MTTC can indicate inefficiencies across the entire workflow.
How to use it: Analyze each stage of the service process for bottlenecks.

What it is: The average time your technicians spend traveling between job sites or from their base to the first job.
Why it matters: Travel time is non-billable and costly (fuel, vehicle wear, technician wages).
How to use it: Implement route optimization software, cluster appointments geographically, and consider technician home-based dispatch.

What it is: The percentage of a technician’s paid hours that are spent on billable work (e.g., actual repair time, not travel or admin).
Why it matters: Higher utilization means your workforce is actively generating revenue.
How to use it: Minimize administrative burden, optimize scheduling to reduce idle time, and equip technicians with mobile tools for on-site data entry.

With FieldCamp’s real-time tracking, you can automatically capture technician activity in the field, distinguishing between billable and non-billable hours through smart time logs and mobile check-ins. It’s the easiest way to maximize every paid hour.
What it is: The average number of jobs a technician completes within a given timeframe.
Why it matters: A direct measure of individual technician output.
How to use it: Compare across technicians to identify best practices. Investigate low performers for training needs or systemic issues.

FieldCamp shows individual technician output and brings full visibility into team performance, helping you identify high-performers, spot inefficiencies, and improve overall team management. Know exactly who’s doing what, when, and how often.
What it is: The percentage of scheduled work orders that are completed.
Why it matters: Indicates your ability to manage and fulfill your workload. A low rate suggests issues with scheduling, capacity, or job complexity.
How to use it: Improve scheduling accuracy, resource leveling, and ensure technicians have the necessary skills for assigned jobs.

What it is: The average time it takes for a technician to get to a customer’s site once dispatched for an immediate response.
Why it matters: Crucial for emergency services and meeting urgent customer needs.
How to use it: Optimize dispatching algorithms for proximity, real-time technician location tracking, and efficient communication.

What it is: The percentage of times technicians stick to their planned schedule, including start times, break times, and job durations.
Why it matters: Good adherence improves predictability, reduces customer wait times, and helps dispatchers manage the day effectively.
How to use it: Provide realistic job estimates, use real-time communication for schedule changes, and offer incentives for adherence.

*Note: “Scheduled Events” could be job start times, break times, etc.
What it is: A combination of First-Time Fix Rate and the time taken for the first visit.
Why it matters: Measures how effectively and quickly the initial interaction resolves the issue.
How to use it: A holistic view that combines speed and quality of initial service.

What it is: The percentage of total labor hours that are paid as overtime.
Why it matters: High overtime can indicate understaffing, inefficient scheduling, or excessive job complexity. It significantly impacts labor costs.
How to use it: Review staffing levels, improve workload balancing, and consider investing in more advanced scheduling tools.

What it is: The total number of service requests received over a specific period.
Why it matters: Helps forecast demand, plan staffing, and identify peak periods.
How to use it: Analyze trends to optimize resource allocation and anticipate future needs.

What it is: The time it takes for a technician to reach the first job site from their starting point (e.g., home or office).
Why it matters: Directly impacts response times and overall efficiency.
How to use it: Improve routing software, assign technicians based on location, and consider stocking vehicles for first-job readiness.

What it is: How effectively your service vehicles are being used (e.g., miles driven per job, hours on the road).
Why it matters: Directly impacts fuel costs, maintenance, and vehicle depreciation.
How to use it: Optimize routing, ensure vehicles are appropriately sized and maintained, and consider electric vehicle options for lower operating costs.

What it is: The average time it takes to repair a specific type of asset or equipment.
Why it matters: Helps in estimating job durations more accurately and identifying complex equipment that requires specialized training.
How to use it: Train technicians on specific equipment, ensure parts availability for common repairs.

What it is: Compares the number of jobs physically completed to the number of jobs that have been billed to the customer.
Why it matters: Highlights potential bottlenecks in your billing process, leading to revenue leakage.
How to use it: Streamline your invoicing procedures, enable technicians to capture necessary billing info on-site.

What it is: The number of scheduled or requested maintenance tasks that are still pending.
Why it matters: A growing backlog can lead to delayed service, increased risk of breakdowns, and customer dissatisfaction.
How to use it: Optimize scheduling, allocate resources effectively, and consider proactive maintenance strategies.

What it is: How frequently specific parts are used in repairs.
Why it matters: Helps in managing inventory effectively, ensuring critical parts are always in stock, and reducing dead stock.
How to use it: Use historical data to forecast demand for parts, optimize truck stock, and streamline digital procurement.

What it is: The average time from job completion to invoice generation and delivery.
Why it matters: Faster invoicing means faster payment and improved cash flow.
How to use it: Implement mobile invoicing, integrate field service management software with accounting, and automate billing processes.

What it is: The percentage of job reports, forms, and other documentation completed digitally by technicians on-site.
Why it matters: Reduces administrative burden, improves data accuracy, and speeds up information flow.
How to use it: Provide intuitive mobile apps for technicians, offer training on digital tools, and make paperless processes the default.

FieldCamp lets technicians complete checklists, forms, capture job photos, and collect e-signatures—all digitally and on-site. No paperwork, no delays—just fast, accurate reporting that turns every technician into a digital pro.
These metrics focus on the financial health of your field service operations, from revenue generation to cost management.

What it is: The percentage increase in revenue generated from your field service operations over a specific period.
Why it matters: Indicates the overall health and expansion of your field service business.
How to use it: Analyze what drives growth (new customers, increased service offerings, higher pricing) and replicate successful strategies.

What it is: The average total cost (labor, parts, travel, overhead) associated with completing a single service job.
Why it matters: Helps determine the profitability of each service and identify areas for cost reduction.
How to use it: Break down costs to identify drivers. Focus on improving FTFR, reducing repeat visits, and optimizing travel.

What it is: The percentage of revenue left after deducting all direct costs associated with delivering service (labor, parts, travel).
Why it matters: Reveals how profitable your service operations truly are.
How to use it: Increase revenue (upselling/cross-selling) and decrease costs (efficiency improvements).

What it is: The average revenue generated by each technician over a given period.
Why it matters: A measure of an individual technician’s financial contribution.
How to use it: Identify top performers, train others on upselling/cross-selling, and ensure fair workload distribution.

What it is: The percentage of new equipment sales or service calls that result in a customer purchasing a service contract or maintenance agreement.
Why it matters: Service contracts provide recurring revenue, improve customer retention, and offer predictable income.
How to use it: Train technicians on the benefits of contracts, offer incentives, and streamline the contract sales process.

What it is: The total cost incurred due to warranty repairs and replacements.
Why it matters: High warranty costs can indicate product quality issues, improper installations, or training gaps.
How to use it: Collaborate with product teams, improve installation quality, and track specific reasons for warranty claims.

What it is: The average amount charged per service job.
Why it matters: Helps understand the scope and value of your typical jobs.
How to use it: Encourage upselling of higher-value services or products, ensure accurate pricing.

What it is: The amount of potential revenue lost due to inefficiencies, errors, or missed billing opportunities (e.g., unbilled parts, services not charged).
Why it matters: Directly impacts profitability.
How to use it: Implement robust tracking, improve billing processes, and provide clear guidelines for what to charge.

What it is: The cash generated by your normal business operations.
Why it matters: Indicates your ability to fund operations and growth without external financing.
How to use it: Improve billing cycles, manage expenses, and optimize inventory turnover.

What it is: The average cost to acquire a new customer (marketing, sales, onboarding costs).
Why it matters: Helps evaluate the efficiency of your marketing and sales efforts. Lower CAC means more efficient growth.
How to use it: Focus on referral programs, customer retention, and optimizing marketing channels.

What it is: The cost of holding unsold inventory (storage, insurance, obsolescence, damage).
Why it matters: High carrying costs tie up capital and reduce profitability.
How to use it: Optimize inventory levels, implement just-in-time practices, and improve forecasting.

These metrics help you understand the performance, well-being, and development of your most valuable asset: your field technicians.

What it is: The percentage of scheduled workdays missed by technicians due to absence.
Why it matters: High absenteeism disrupts schedules, increases overtime for others, and impacts service delivery.
How to use it: Investigate reasons for absence (e.g., burnout, poor morale, health issues) and implement wellness programs or improved work-life balance.

What it is: The percentage of technicians who leave your company over a specific period.
Why it matters: High turnover is costly (recruitment, training, lost productivity) and can impact team morale and service consistency.
How to use it: Conduct exit interviews, improve compensation and benefits, offer career development paths, and foster a positive work environment.

What it is: The average number of hours each technician spends on training and development.
Why it matters: Investing in training improves skills, increases efficiency, and boosts technician confidence and job satisfaction.
How to use it: Link training to FTFR and MTTR improvements. Ensure training is relevant to new technologies and common service issues.

What it is: The number of workplace accidents or safety incidents per a given number of working hours or jobs.
Why it matters: Technician safety is paramount. High incident rates indicate inadequate safety protocols or training.
How to use it: Implement rigorous safety training, provide proper PPE, conduct regular safety audits, and encourage incident reporting without fear of reprisal.

*Note: 200,000 represents the base hours for 100 full-time equivalent employees working 40 hours per week, 50 weeks per year, a common OSHA standard.
What it is: The percentage of jobs or technicians adhering to all relevant safety procedures and regulations.
Why it matters: Ensures technician well-being, avoids fines, and maintains your company’s reputation.
How to use it: Regular audits, clear guidelines, and ongoing training.

Inventory & Asset Management Metrics (Having What You Need, When You Need It)
Efficient management of parts, tools, and company assets is crucial for timely service delivery and cost control.
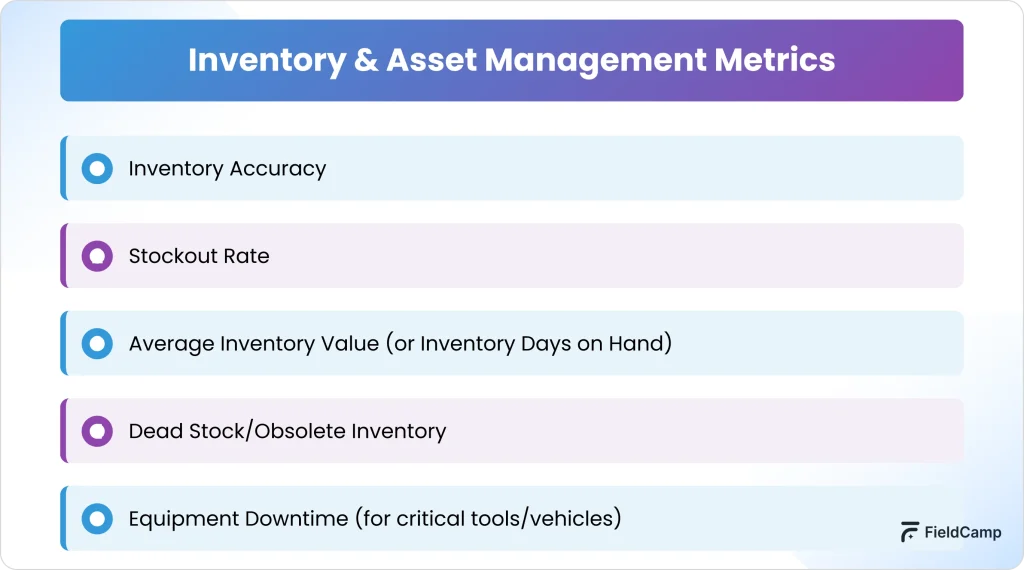
What it is: The percentage of inventory records that precisely match the physical count of parts on hand (in warehouses and on trucks).
Why it matters: Inaccurate inventory leads to stockouts, delayed repairs, and wasted time searching for parts.
How to use it: Implement regular cycle counts, use inventory management software, and barcode scanning.

What it is: The percentage of times a required part is not available when needed, leading to a delay or repeat visit.
Why it matters: Directly impacts FTFR, MTTR, and customer satisfaction.
How to use it: Improve demand forecasting, optimize safety stock levels, and streamline supplier relationships.

What it is: The average monetary value of inventory held over a period, or the number of days it takes to sell off existing inventory.
Why it matters: High inventory value ties up capital that could be used elsewhere.
How to use it: Aim for a lean inventory while ensuring sufficient stock of critical parts.

What it is: The value or percentage of inventory that has not been used or sold for a significant period and is unlikely to be used in the future.
Why it matters: It represents wasted capital and takes up valuable storage space.
How to use it: Implement robust inventory management, analyze demand patterns, and consider selling off or discarding obsolete items.

What it is: The amount of time key equipment or vehicles are out of service due to maintenance or repair.
Why it matters: Impacts technician productivity and ability to take on jobs.
How to use it: Implement preventative maintenance schedules for vehicles and critical tools to minimize unexpected breakdowns.

By consistently tracking and analyzing these 51 field service management metrics and KPIs, your business can gain a competitive edge in 2026 and beyond. It’s not just about collecting data; it’s about transforming that data into actionable insights that drive continuous improvement, operational excellence, and lasting customer satisfaction.
The foundation of field service management rests on three core elements: scheduling and dispatching, work order management, and customer experience.
Efficient scheduling ensures the right technician is sent to the right job at the right time. Work order management keeps all job-related information—like customer details, notes, and checklists—centralized and accessible. And finally, delivering a great customer experience through timely service and clear communication builds trust and loyalty. When these three elements work together, your operations become smoother, faster, and more customer-centric.
Improving the first-time fix rate starts with preparation. When technicians have access to the right tools, job history, and diagnostic information before they arrive on site, they’re far more likely to resolve issues during the first visit.
Training also plays a major role, ensuring your team is up to date with the equipment they service.
Tools like FieldCamp help technicians by giving them instant mobile access to job forms, parts checklists, and service records, all of which contribute to higher fix rates and happier customers.
Reducing mean time to repair (MTTR) requires both skilled technicians and streamlined workflows. Faster diagnostics, real-time inventory access, and clear service protocols all help bring down repair time. Equipping your team with mobile access to service manuals, past job data, and automated checklists minimizes delays on-site. FieldCamp also helps track MTTR trends, so you can identify slowdowns and act quickly to fix them, whether it’s a process gap, training issue, or parts delay.
Effective route planning is all about smart job assignment. When you assign technicians based on real-time location, skillset, and proximity to the customer, travel time drops significantly. Route optimization software, like what’s built into FieldCamp, automatically groups jobs by area and reorders them for the shortest path. This not only helps reduce fuel and labor costs but also ensures more on-time arrivals, fewer delays, and higher technician productivity.
To improve customer satisfaction, focus on metrics that directly reflect the service experience. Start with Customer Satisfaction Score (CSAT), which captures how customers feel after each visit. First-time fix rate is another important one—it shows whether issues are being resolved quickly and accurately. Add in the on-time arrival rate, average response time, and how fast you resolve complaints. Together, these KPIs give you a complete picture of what matters most to your customers and where to fine-tune operations.
AI can make field service scheduling smarter by analyzing historical data, technician skill levels, and geographic proximity to assign jobs more accurately. It helps predict how long each job will take and automatically prioritizes urgent or nearby tasks to save travel time.
Platforms like FieldCamp use AI-driven logic to match the right technician with the right job, balancing workloads, reducing overtime, and improving service speed—all without manual effort.